Philips 2011 Annual Report Download - page 138
Download and view the complete annual report
Please find page 138 of the 2011 Philips annual report below. You can navigate through the pages in the report by either clicking on the pages listed below, or by using the keyword search tool below to find specific information within the annual report.-
 1
1 -
2
-
3
-
4
-
5
-
6
-
7
-
8
-
9
-
10
-
11
-
12
-
13
-
14
-
15
-
16
-
17
-
18
-
19
-
20
-
21
-
22
-
23
-
24
-
25
-
26
-
27
-
28
-
29
-
30
-
31
-
32
-
33
-
34
-
35
-
36
-
37
-
38
-
39
-
40
-
41
-
42
-
43
-
44
-
45
-
46
-
47
-
48
-
49
-
50
-
51
-
52
-
53
-
54
-
55
-
56
-
57
-
58
-
59
-
60
-
61
-
62
-
63
-
64
-
65
-
66
-
67
-
68
-
69
-
70
-
71
-
72
-
73
-
74
-
75
-
76
-
77
-
78
-
79
-
80
-
81
-
82
-
83
-
84
-
85
-
86
-
87
-
88
-
89
-
90
-
91
-
92
-
93
-
94
-
95
-
96
-
97
-
98
-
99
-
100
-
101
-
102
-
103
-
104
-
105
-
106
-
107
-
108
-
109
-
110
-
111
-
112
-
113
-
114
-
115
-
116
-
117
-
118
-
119
-
120
-
121
-
122
-
123
-
124
-
125
-
126
-
127
-
 128
128 -
 129
129 -
 130
130 -
 131
131 -
 132
132 -
 133
133 -
 134
134 -
 135
135 -
 136
136 -
 137
137 -
 138
138 -
 139
139 -
 140
140 -
 141
141 -
 142
142 -
 143
143 -
 144
144 -
 145
145 -
 146
146 -
 147
147 -
 148
148 -
149
-
150
-
151
-
152
-
153
-
154
-
155
-
156
-
157
-
158
-
159
-
160
-
161
-
162
-
163
-
164
-
165
-
166
-
167
-
168
-
169
-
170
-
171
-
172
-
173
-
174
-
175
-
176
-
177
-
178
-
179
-
180
-
181
-
182
-
183
-
184
-
185
-
186
-
187
-
188
-
189
-
190
-
191
-
192
-
193
-
194
-
195
-
196
-
197
-
198
-
199
-
200
-
201
-
202
-
203
-
204
-
205
-
206
-
207
-
208
-
209
-
210
-
211
-
212
-
213
-
214
-
215
-
216
-
217
-
218
-
219
-
220
-
221
-
222
-
223
-
224
-
225
-
226
-
227
-
228
 |
 |

2 12 Group financial statements 12.11 - 12.11
138 Annual Report 2011
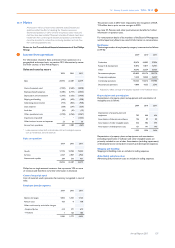
Audit fees
Fees KPMG
in millions of euros
2009 2010 2011
Audit fees 16.3 16.4 15.6
- consolidated financial statements 11.1 10.6 10.1
- statutory financial statements 5.2 5.8 5.5
Audit-related fees1) 1.2 2.3 1.9
- acquisitions and divestments 0.2 1.0 0.1
- other 1 1.3 1.8
Tax fees2) 0.9 0.4 0.9
-tax compliance services 0.9 0.4 0.9
Other fees3) 1.3 1.3 1.0
- royalty investigation 0.6 0.3 0.4
- sustainability and other services 0.7 1.0 0.6
Total 19.7 20.4 19.4
1) The percentage of services provided in 2011 is 9.8% of the total fees
2) The percentage of services provided in 2011 is 4.6% of the total fees
3) The percentage of services provided in 2011 is 5.2% of the total fees
This table ’Fees KPMG’ forms an integral part of the Company Financial
Statements, please refer to note J, Audit fees.
Impairment of goodwill
In 2011, goodwill has been impaired in the Healthcare sector for an
amount of EUR 824 million and in the Lighting sector for an amount of
EUR 531 million. For further information on impairment of goodwill,
see note 9, Goodwill.
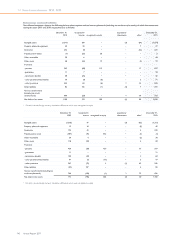
Other business income (expenses)
Other business income (expenses) consists of the following:
2009 2010 2011
Result on disposal of businesses:
- income 13 9 28
- expense (17) (10) (26)
Result on disposal of fixed assets:
- income 33 49 47
- expense (13) (9) (11)
Result on other remaining businesses:
- income 49 35 50
- expense (12) (8) (38)
53 66 50
Total other business income 95 93 125
Total other business expense (42) (27) (75)
In 2011, income from results of disposal of fixed assets was mainly due
to sale of buildings in Italy, Singapore, Turkey, Chile and Brazil.
In 2011, income from results on other remaining businesses was due
to non-core revenue.
In 2011, results on other remaining business expenses were mainly due
to provision for legal exposure, related to the Cathode-Ray Tubes
(CRT) case. For further information, see note 25, Contingent liabilities.
2Financial income and expenses
2009 2010 2011
Interest income 45 40 38
Interest income from loans and receivables 18 17 4
Interest income from cash and cash
equivalents 27 23 34
Dividend income from available for sale
financial assets 16 6 11
Net gains from disposal of financial assets 126 162 51
Net change in fair value of financial assets
at fair value through profit or loss 20 − 6
Net foreign exchange gains − 1 −
Other finance income 18 5 6
Finance income 225 214 112
Interest expense (297) (265) (248)
Interest on debts and borrowings (294) (263) (245)
Finance charges under finance lease
contract (3) (2) (3)
Unwind of discount of provisions (15) (20) (33)
Net foreign exchange losses (3) − (2)
Impairment loss of financial assets (58) (2) (34)
Net change in fair value of financial assets
at fair value through profit or loss − (21) −
Other finance expenses (14) (27) (35)
Finance expense (387) (335) (352)
Financial income and expenses (162) (121) (240)
Net financial income and expense showed a EUR 240 million expense
in 2011, which was EUR 119 million higher than in 2010. Total finance
income of EUR 112 million included EUR 51 million gain on the disposal
of financial assets, of which EUR 44 million resulted from the sale of
shares in TCL and EUR 6 million resulted from the sale of Digimarc.
Remaining financial income included dividend income of EUR 11 million
and a total net EUR 6 million gain from fair value changes, mainly the
revaluation of the NXP option. Total finance expense of EUR 352
million included EUR 34 million impairment charges, mainly related to
the shareholding in TPV Technology. Other financial expense consisted
of EUR 33 million of accretion expenses mainly associated with
discounted provisions and uncertain tax positions and EUR 35 million
other financing charges.
Net financial income and expense showed a EUR 121 million expense
in 2010, which was EUR 41 million lower than in 2009. Total finance
income of EUR 214 million included EUR 162 million gain on the
disposal of financial assets, of which EUR 154 million resulted from the
sale of shares in NXP (please refer to Other non-current financial assets
for more details) and EUR 4 million resulted from the sale of SHL
Telemedicine Ltd.. Interest income from loans and receivables included
EUR 15 million related to interest received on the convertible bonds
received from the shareholding in TPV Technology and CBaySystems
Holdings (CBAY). Total finance expense of EUR 335 million included
EUR 21 million of losses mainly in relation to fair value revaluations on
the convertible bonds received from TPV Technology and CBAY prior
to their redemption in September and October respectively.
Net financial income and expense showed a EUR 162 million expense
in 2009. Financial income was EUR 225 million, including EUR 126
million income from the disposal of financial assets, mainly from a EUR
69 million gain from the sale of remaining shares in LG Display, and a
EUR 48 million gain from the sale of remaining shares in Pace Micro
Technology. During 2009, Philips had a net EUR 20 million fair value
gain mainly related to the revaluation of the convertible bonds received
from TPV Technology and CBAY. Philips also received EUR 16 million
dividend income, of which EUR 12 million related to holdings in LG