Philips 2011 Annual Report Download - page 180
Download and view the complete annual report
Please find page 180 of the 2011 Philips annual report below. You can navigate through the pages in the report by either clicking on the pages listed below, or by using the keyword search tool below to find specific information within the annual report.-
 1
1 -
2
-
3
-
4
-
5
-
6
-
7
-
8
-
9
-
10
-
11
-
12
-
13
-
14
-
15
-
16
-
17
-
18
-
19
-
20
-
21
-
22
-
23
-
24
-
25
-
26
-
27
-
28
-
29
-
30
-
31
-
32
-
33
-
34
-
35
-
36
-
37
-
38
-
39
-
40
-
41
-
42
-
43
-
44
-
45
-
46
-
47
-
48
-
49
-
50
-
51
-
52
-
53
-
54
-
55
-
56
-
57
-
58
-
59
-
60
-
61
-
62
-
63
-
64
-
65
-
66
-
67
-
68
-
69
-
70
-
71
-
72
-
73
-
74
-
75
-
76
-
77
-
78
-
79
-
80
-
81
-
82
-
83
-
84
-
85
-
86
-
87
-
88
-
89
-
90
-
91
-
92
-
93
-
94
-
95
-
96
-
97
-
98
-
99
-
100
-
101
-
102
-
103
-
104
-
105
-
106
-
107
-
108
-
109
-
110
-
111
-
112
-
113
-
114
-
115
-
116
-
117
-
118
-
119
-
120
-
121
-
122
-
123
-
124
-
125
-
126
-
127
-
128
-
129
-
130
-
131
-
132
-
133
-
134
-
135
-
136
-
137
-
138
-
139
-
140
-
141
-
142
-
143
-
144
-
145
-
146
-
147
-
148
-
149
-
150
-
151
-
152
-
153
-
154
-
155
-
156
-
157
-
158
-
159
-
160
-
161
-
162
-
163
-
164
-
165
-
166
-
167
-
168
-
169
-
 170
170 -
 171
171 -
 172
172 -
 173
173 -
 174
174 -
 175
175 -
 176
176 -
 177
177 -
 178
178 -
 179
179 -
 180
180 -
 181
181 -
 182
182 -
 183
183 -
 184
184 -
 185
185 -
 186
186 -
 187
187 -
 188
188 -
 189
189 -
 190
190 -
191
-
192
-
193
-
194
-
195
-
196
-
197
-
198
-
199
-
200
-
201
-
202
-
203
-
204
-
205
-
206
-
207
-
208
-
209
-
210
-
211
-
212
-
213
-
214
-
215
-
216
-
217
-
218
-
219
-
220
-
221
-
222
-
223
-
224
-
225
-
226
-
227
-
228
 |
 |

13 Company financial statements 13.4 - 13.4
180 Annual Report 2011
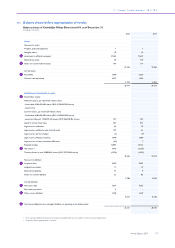
Treasury shares
In connection with the Company’s share repurchase programs, shares
which have been repurchased and are held in treasury for (i) delivery
upon exercise of options and convertible personnel debentures and
under restricted share programs and employee share purchase
programs, and (ii) capital reduction purposes, are accounted for as a
reduction of shareholders’ equity. Treasury shares are recorded at
cost, representing the market price on the acquisition date. When
issued, shares are removed from treasury shares on a FIFO basis.
Any difference between the cost and the cash received at the time
treasury shares are issued, is recorded in capital in excess of par value,
except in the situation in which the cash received is lower than cost,
and capital in excess of par has been depleted.
The following transactions took place resulting from employee option
and share plans:
2010 2011
Shares acquired 15,237 32,484
Average market price EUR 25.35 EUR 19.94
Amount paid − EUR 1 million
Shares delivered 5,397,514 4,200,181
Average market price EUR 23.99 EUR 20.54
Amount received EUR 71 million EUR 87 million
Total shares in treasury at
year-end 37,720,402 33,552,705
Total cost EUR 1,051 million EUR 965 million
In order to reduce share capital, the following transactions took place in
2011 (there were no transactions to reduce share capital in 2011):
2010 2011
Shares acquired − 47,475,840
Average market price − EUR 14.74
Amount paid − EUR 700 million
Reduction of capital stock − −
Total shares in treasury at
year-end 1,851,998 49,327,838
Total cost EUR 25 million EUR 725 million
Dividend distributed from retained earnings
A proposal will be submitted to the General Meeting of Shareholders
to pay a dividend of EUR 0.75 per common share, in cash or shares at
the option of the shareholder, from retained earnings.
Legal reserves
As of December 31, 2011, legal reserves relate to the revaluation of
assets and liabilities of acquired companies in the context of multi-
stage acquisitions of EUR 70 million (2010: EUR 86 million), unrealized
gains on available-for-sale financial assets of EUR 45 million (2010: EUR
139 million), unrealized losses on cash flow hedges of EUR 9 million
(2010: unrealized losses of EUR 5 million), ‘affiliated companies’ of EUR
1,089 million (2010: EUR 1,078 million) and currency translation gains
of EUR 7 million (2010: losses of EUR 65 million).
The item ‘affiliated companies’ relates to the ‘wettelijke reserve
deelnemingen’, which is required by Dutch law. This reserve relates to
any legal or economic restrictions on the ability of affiliated companies
to transfer funds to the parent company in the form of dividends.
Limitations in the distribution of shareholders’ equity
Pursuant to Dutch law, limitations exist relating to the distribution of
shareholders’ equity of EUR 1,413 million (2010: EUR 1,500 million).
As at December 31, 2011, such limitations relate to common shares of
EUR 202 million (2010: EUR 197 million) as well as to legal reserves
included under ‘revaluation’ of EUR 70 million (2010: EUR 86 million),
currency translation gains of EUR 7 million (2010 involved losses, see
comment below), available-for-sale financial assets of EUR 45 million
(2010: EUR 139 million) and ‘affiliated companies’ of EUR 1,089 million
(2010: EUR 1,078 million).
In general, gains related to currency translation differences, available-
for-sale financial assets and cash flow hedges cannot be distributed as
part of shareholders’ equity as they form part of the legal reserves
protected under Dutch law. By their nature, losses relating to currency
translation differences, available-for-sale financial assets and cash flow
hedges reduce shareholders’ equity, and thereby distributable amounts.
Therefore, gains related to currency translation differences (2011: EUR
7 million) and available-for-sale financial assets (2011: EUR 45 million)
included in other reserves limit the distribution of shareholders’ equity.
The losses related to cash flow hedges (2011: EUR 9 million) reduce
the distributable amount by their nature.