Philips 2011 Annual Report Download - page 4
Download and view the complete annual report
Please find page 4 of the 2011 Philips annual report below. You can navigate through the pages in the report by either clicking on the pages listed below, or by using the keyword search tool below to find specific information within the annual report.-
 1
1 -
 2
2 -
 3
3 -
 4
4 -
 5
5 -
 6
6 -
 7
7 -
 8
8 -
 9
9 -
 10
10 -
 11
11 -
 12
12 -
 13
13 -
 14
14 -
 15
15 -
16
-
17
-
18
-
19
-
20
-
21
-
22
-
23
-
24
-
25
-
26
-
27
-
28
-
29
-
30
-
31
-
32
-
33
-
34
-
35
-
36
-
37
-
38
-
39
-
40
-
41
-
42
-
43
-
44
-
45
-
46
-
47
-
48
-
49
-
50
-
51
-
52
-
53
-
54
-
55
-
56
-
57
-
58
-
59
-
60
-
61
-
62
-
63
-
64
-
65
-
66
-
67
-
68
-
69
-
70
-
71
-
72
-
73
-
74
-
75
-
76
-
77
-
78
-
79
-
80
-
81
-
82
-
83
-
84
-
85
-
86
-
87
-
88
-
89
-
90
-
91
-
92
-
93
-
94
-
95
-
96
-
97
-
98
-
99
-
100
-
101
-
102
-
103
-
104
-
105
-
106
-
107
-
108
-
109
-
110
-
111
-
112
-
113
-
114
-
115
-
116
-
117
-
118
-
119
-
120
-
121
-
122
-
123
-
124
-
125
-
126
-
127
-
128
-
129
-
130
-
131
-
132
-
133
-
134
-
135
-
136
-
137
-
138
-
139
-
140
-
141
-
142
-
143
-
144
-
145
-
146
-
147
-
148
-
149
-
150
-
151
-
152
-
153
-
154
-
155
-
156
-
157
-
158
-
159
-
160
-
161
-
162
-
163
-
164
-
165
-
166
-
167
-
168
-
169
-
170
-
171
-
172
-
173
-
174
-
175
-
176
-
177
-
178
-
179
-
180
-
181
-
182
-
183
-
184
-
185
-
186
-
187
-
188
-
189
-
190
-
191
-
192
-
193
-
194
-
195
-
196
-
197
-
198
-
199
-
200
-
201
-
202
-
203
-
204
-
205
-
206
-
207
-
208
-
209
-
210
-
211
-
212
-
213
-
214
-
215
-
216
-
217
-
218
-
219
-
220
-
221
-
222
-
223
-
224
-
225
-
226
-
227
-
228
 |
 |

Performance highlights
4 Annual Report 2011
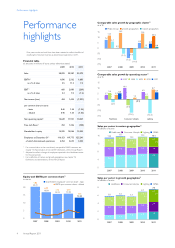
Performance
highlights
Prior years results and cash flows have been restated to reflect the effect of
classifying the Television business as discontinued operations in 2011.
Financial table
all amounts in millions of euros unless otherwise stated
2009 2010 2011
Sales 20,092 22,287 22,579
EBITA1) 1,096 2,562 1,680
as a % of sales 5.5 11.5 7.4
EBIT1) 660 2,080 (269)
as a % of sales 3.3 9.3 (1.2)
Net income (loss) 424 1,452 (1,291)
per common share in euros
- basic 0.46 1.54 (1.36)
- diluted 0.46 1.53 (1.36)
Net operating capital1) 12,649 11,951 10,427
Free cash flows1) 763 1,356 (108)
Shareholders’ equity 14,595 15,046 12,355
Employees at December 312) 116,153 119,775 125,241
of which discontinued operations 4,764 3,610 3,353
1) For a reconciliation to the most directly comparable GAAP measures, see
chapter 15, Reconciliation of non-GAAP information, of this Annual Report
2) Adjusted to reflect a change of employees reported in the Healthcare sector
for the past periods
3) For a definition of mature and growth geographies, see chapter 18,
Definitions and abbreviations, of this Annual Report
Equity and EBITA per common share1)
in euros ■-shareholders’ equity per common share - basic
--EBITA per common share - diluted
20
15
10
5
0
1.83
20.41
2007
0.99
16.84
2008
1.18
15.74
2009
2.70
15.90
2010
1.76
13.34
2011
Comparable sales growth by geographic cluster1)
as a %
■-Philips Group--■-growth geographies--■-mature geographies
15
10
5
0
(5)
(10)
(15)
7.6
11.7
6.1
2007
0.2
14.2
(5.1)
2008
(9.2)
(4.4)
(11.0)
2009
4.8
13.6
1.2
2010
4.1
11.1
1.0
2011
Comparable sales growth by operating sector1)
as a % ■-2007_■-2008_■-2009_■-2010_■-2011
15
10
5
0
(5)
(10)
(15)
3.7
5.6
(2.7)
3.9 5.3
Healthcare
10.0
(5.4)
(12.0)
1.3
(0.1)
Consumer Lifestyle
6.5
3.1
(12.6)
8.7
6.1
Lighting
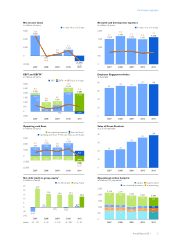
Sales per sector in mature geographies3)
in billions of euros
■-Healthcare_■-Consumer Lifestyle_■-Lighting_■-GM&S
16
12
8
4
0
2007
5.5
4.8
4.1
0.6
15.0
2008
6.4
4.0
5.0
0.3
15.7
2009
6.4
3.5
4.3
0.2
14.4
2010
6.9
3.6
4.7
0.2
15.4
2011
7.0
3.4
4.5
0.2
15.1
Sales per sector in growth geographies3)
in billions of euros
■-Healthcare_■-Consumer Lifestyle _■-Lighting_■-GM&S
8
6
4
2
0
2007
1.1
2.3
2.2
0.2
5.8
2008
1.2
2.2
2.4
0.2
6.0
2009
1.5
1.9
2.2
0.1
5.7
2010
1.7
2.2
2.9
0.1
6.9
2011
1.9
2.4
3.1
0.1
7.5