Philips 2011 Annual Report Download - page 38
Download and view the complete annual report
Please find page 38 of the 2011 Philips annual report below. You can navigate through the pages in the report by either clicking on the pages listed below, or by using the keyword search tool below to find specific information within the annual report.-
 1
1 -
2
-
3
-
4
-
5
-
6
-
7
-
8
-
9
-
10
-
11
-
12
-
13
-
14
-
15
-
16
-
17
-
18
-
19
-
20
-
21
-
22
-
23
-
24
-
25
-
26
-
27
-
 28
28 -
 29
29 -
 30
30 -
 31
31 -
 32
32 -
 33
33 -
 34
34 -
 35
35 -
 36
36 -
 37
37 -
 38
38 -
 39
39 -
 40
40 -
 41
41 -
 42
42 -
 43
43 -
 44
44 -
 45
45 -
 46
46 -
 47
47 -
 48
48 -
49
-
50
-
51
-
52
-
53
-
54
-
55
-
56
-
57
-
58
-
59
-
60
-
61
-
62
-
63
-
64
-
65
-
66
-
67
-
68
-
69
-
70
-
71
-
72
-
73
-
74
-
75
-
76
-
77
-
78
-
79
-
80
-
81
-
82
-
83
-
84
-
85
-
86
-
87
-
88
-
89
-
90
-
91
-
92
-
93
-
94
-
95
-
96
-
97
-
98
-
99
-
100
-
101
-
102
-
103
-
104
-
105
-
106
-
107
-
108
-
109
-
110
-
111
-
112
-
113
-
114
-
115
-
116
-
117
-
118
-
119
-
120
-
121
-
122
-
123
-
124
-
125
-
126
-
127
-
128
-
129
-
130
-
131
-
132
-
133
-
134
-
135
-
136
-
137
-
138
-
139
-
140
-
141
-
142
-
143
-
144
-
145
-
146
-
147
-
148
-
149
-
150
-
151
-
152
-
153
-
154
-
155
-
156
-
157
-
158
-
159
-
160
-
161
-
162
-
163
-
164
-
165
-
166
-
167
-
168
-
169
-
170
-
171
-
172
-
173
-
174
-
175
-
176
-
177
-
178
-
179
-
180
-
181
-
182
-
183
-
184
-
185
-
186
-
187
-
188
-
189
-
190
-
191
-
192
-
193
-
194
-
195
-
196
-
197
-
198
-
199
-
200
-
201
-
202
-
203
-
204
-
205
-
206
-
207
-
208
-
209
-
210
-
211
-
212
-
213
-
214
-
215
-
216
-
217
-
218
-
219
-
220
-
221
-
222
-
223
-
224
-
225
-
226
-
227
-
228
 |
 |

5 Group performance 5.1.4 - 5.1.4
38 Annual Report 2011
The funded status of our defined benefit plans
deteriorated in 2011 due to adverse market movements
and lower interest rates. However, this was largely offset
by the unrecognized surpluses of the Group’s main plans,
reducing the impact on the net balance sheet position.
In 2010, results were positively impacted by the
recognition of EUR 119 million of negative prior-service
costs. These resulted from a reduction of pension benefits
expected to be paid in the future, in part due to a change in
indexation. In 2010, a curtailment gain of EUR 9 million
on one of our retiree medical plans was recognized due
to the partial closure of a US site.
For further information, refer to note 29, Pensions and
other postretirement benefits.
5.1.4 Restructuring and impairment charges
In 2011, EBIT included net charges totaling EUR 1,572
million for restructuring and related asset impairments.
The annual impairment test led to selected adjustments
of pre-recession business cases as well as an adjustment
of the discount rate across Philips, leading to a EUR 1,355
million impairment of goodwill. In addition to the annual
goodwill impairment tests, trigger-based impairment tests
were performed during the year, but resulted in no
further goodwill impairments. 2011 also included a EUR
128 million charge related to the impairment of customer
relationships and brand names at Consumer Luminaires.
2010 included EUR 132 million in restructuring and
related asset impairment charges.
For further information on sensitivity analysis, please refer
to note 9, Goodwill.
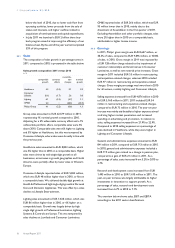
Restructuring and related charges
in millions of euros
2009 2010 2011
Restructuring and related charges per
sector:
Healthcare 42 48 3
Consumer Lifestyle 57 12 9
Lighting 225 74 54
Group Management & Services 63 (2) 23
Continuing operations 387 132 89
Discontinued operations 63 30 15
Cost breakdown of restructuring and
related charges:
Personnel lay-off costs 331 151 109
Release of provision (66) (70) (45)
Restructuring-related asset impairment 81 14 10
Other restructuring-related costs 41 37 15
Continuing operations 387 132 89
Discontinued operations 63 30 15
In 2011, the most significant restructuring projects related
to Lighting and Group Management & Services and were
mainly driven by our change program Accelerate!.
Restructuring projects at Lighting centered on Luminaires
businesses and Lamps, the largest of which took place in
the Netherlands, Brazil and in the US. Group Management
& Services restructuring projects focused on the Global
Service Units (primarily in the Netherlands), Corporate
and Country Overheads (mainly in the Netherlands, Brazil
and Italy) and Philips Design (the Netherlands). In
Healthcare, the largest projects were undertaken in
Imaging Systems, Home Healthcare Solutions and Patient
Care & Clinical Informatics in various locations in the US
to reduce the operating costs and simplify the
organization. Consumer Lifestyle restructuring charges
mainly related to our remaining Television operations in
Europe.
The restructuring charges in 2010 were mainly
attributable to the operating sectors. Within Healthcare,
the largest projects related to the reorganization of the
commercial organization in Imaging Systems (Germany,
the Netherlands and the US). Consumer Lifestyle
restructuring charges were mainly in Lifestyle
Entertainment, primarily in the Netherlands and the US.
Restructuring projects in Lighting were focused on the
reduction of production capacity in traditional lighting
technologies, such as incandescent. The largest projects
were initiated in Brazil, France and the US.
For further information on restructuring, refer to note 20,
Provisions.