Philips 2011 Annual Report Download - page 44
Download and view the complete annual report
Please find page 44 of the 2011 Philips annual report below. You can navigate through the pages in the report by either clicking on the pages listed below, or by using the keyword search tool below to find specific information within the annual report.-
 1
1 -
2
-
3
-
4
-
5
-
6
-
7
-
8
-
9
-
10
-
11
-
12
-
13
-
14
-
15
-
16
-
17
-
18
-
19
-
20
-
21
-
22
-
23
-
24
-
25
-
26
-
27
-
28
-
29
-
30
-
31
-
32
-
33
-
 34
34 -
 35
35 -
 36
36 -
 37
37 -
 38
38 -
 39
39 -
 40
40 -
 41
41 -
 42
42 -
 43
43 -
 44
44 -
 45
45 -
 46
46 -
 47
47 -
 48
48 -
 49
49 -
 50
50 -
 51
51 -
 52
52 -
 53
53 -
 54
54 -
55
-
56
-
57
-
58
-
59
-
60
-
61
-
62
-
63
-
64
-
65
-
66
-
67
-
68
-
69
-
70
-
71
-
72
-
73
-
74
-
75
-
76
-
77
-
78
-
79
-
80
-
81
-
82
-
83
-
84
-
85
-
86
-
87
-
88
-
89
-
90
-
91
-
92
-
93
-
94
-
95
-
96
-
97
-
98
-
99
-
100
-
101
-
102
-
103
-
104
-
105
-
106
-
107
-
108
-
109
-
110
-
111
-
112
-
113
-
114
-
115
-
116
-
117
-
118
-
119
-
120
-
121
-
122
-
123
-
124
-
125
-
126
-
127
-
128
-
129
-
130
-
131
-
132
-
133
-
134
-
135
-
136
-
137
-
138
-
139
-
140
-
141
-
142
-
143
-
144
-
145
-
146
-
147
-
148
-
149
-
150
-
151
-
152
-
153
-
154
-
155
-
156
-
157
-
158
-
159
-
160
-
161
-
162
-
163
-
164
-
165
-
166
-
167
-
168
-
169
-
170
-
171
-
172
-
173
-
174
-
175
-
176
-
177
-
178
-
179
-
180
-
181
-
182
-
183
-
184
-
185
-
186
-
187
-
188
-
189
-
190
-
191
-
192
-
193
-
194
-
195
-
196
-
197
-
198
-
199
-
200
-
201
-
202
-
203
-
204
-
205
-
206
-
207
-
208
-
209
-
210
-
211
-
212
-
213
-
214
-
215
-
216
-
217
-
218
-
219
-
220
-
221
-
222
-
223
-
224
-
225
-
226
-
227
-
228
 |
 |

5 Group performance 5.2.2 - 5.2.3
44 Annual Report 2011
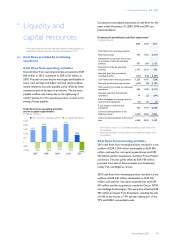
Net capital expenditures
Net capital expenditures totaled EUR 944 million, which
was EUR 179 million higher than 2010. Higher
investments were visible in all sectors, notably additional
growth-focused investments in Healthcare.
Cash flows from acquisitions,
divestments and derivatives
in millions of euros
■-divestments and derivatives--■-acquisitions
6,000
3,000
0
(3,000)
(6,000)
6,129
(1,502)
4,627
2007
2,936
(5,331)
(2,395)
2008
764
(301)
463
2009
360
(241)
119
2010
132
(552)
(420)
2011
Acquisitions
Net cash impact of acquisitions in 2011 was a total of EUR
552 million, mainly related to the acquisitions for Povos,
Preethi and Sectra.
In 2010, a total of EUR 241 million cash was used for
acquisitions, mainly Discus, NCW and medSage
Technologies.
Divestments and derivatives
Cash proceeds of EUR 106 million were received from
divestments, mainly attributable to EUR 69 million for the
sale of remaining shares in TCL, as well as divestments of
non-strategic businesses within Consumer Lifestyle and
Healthcare. Cash flows from derivatives and securities led
to a net cash inflow of EUR 26 million.
In 2010, cash proceeds of EUR 385 million were received
from divestments, including EUR 98 million from the sale
of 9.4% shares in TPV, EUR 165 million and EUR 74 million
from the redemption of the TPV and CBAY convertible
bonds respectively. The transaction related to the sale of
the remaining NXP shares to Philips UK pension fund
which was cash-neutral. Net cash flows used for
derivatives led to a EUR 25 million net outflow.
Cash flows from financing activities
Net cash used for financing activities in 2011 was EUR
1,787 million. Philips’ shareholders were paid EUR 711
million in the form of a dividend of which cash dividend
amounted to EUR 259 million. The net impact of changes
in debt was a decrease of EUR 857 million, including the
redemption of a EUR 750 million bond, a USD 350 million
bond and other debts totaling EUR 1,314 million, partially
offset by the drawdown of EUR 200 million committed
facility and other new long-term borrowing totaling EUR
457 million. Additionally, net cash outflows for share
buyback and share delivery totaled EUR 671 million.
Net cash used for financing activities in 2010 was EUR 95
million. Philips’ shareholders were paid EUR 650 million
in the form of a dividend of which cash dividend amounted
to EUR 296 million. The net impact of changes in debt was
an increase of EUR 136 million, including a EUR 214
million increase from finance lease and bank loans,
partially offset by repayments on short-term debts and
other long-term debt amounting to EUR 78 million.
Additionally, net cash inflows for share delivery totaled
EUR 65 million.
5.2.2 Cash flows from discontinued operations
In 2011, EUR 364 million cash was used by discontinued
operations, attributable to the operating cash flows of the
Television business of EUR 270 million and cash flow to
investing activities of EUR 94 million.
In 2010, EUR 22 million cash was used by discontinued
operations, attributable to cash flow to investing activities
of EUR 56 million of the Television business and partially
offset by EUR 34 million of operating cash flows.
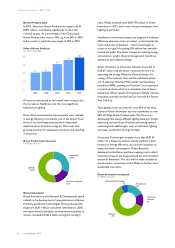
5.2.3 Financing
Condensed consolidated balance sheets for the years
2009, 2010 and 2011 are presented below:
Condensed consolidated balance sheet information1)
in millions of euros
2009 2010 2011
Intangible assets 11,523 12,233 11,012
Property, plant and equipment 3,252 3,145 3,014
Inventories 2,913 3,865 3,625
Receivables 7,188 6,296 6,839
Accounts payable and other liabilities (9,166) (10,180) (10,017)
Provisions (2,450) (2,339) (2,639)
Other financial assets 984 596 575
Investments in associates 281 181 203
14,525 13,797 12,612
Cash and cash equivalents 4,386 5,833 3,147
Debt (4,267) (4,658) (3,860)
Net cash (debt) 119 1,175 (713)
Non-controlling interests (49) (46) (34)
Shareholders’ equity (14,595) (15,046) (12,355)
(14,525) (13,917) (13,102)
1) Please refer to section 12.6, Consolidated balance sheets, of this Annual Report