Philips 2011 Annual Report Download - page 179
Download and view the complete annual report
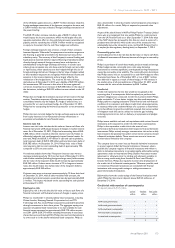
Please find page 179 of the 2011 Philips annual report below. You can navigate through the pages in the report by either clicking on the pages listed below, or by using the keyword search tool below to find specific information within the annual report.-
 1
1 -
2
-
3
-
4
-
5
-
6
-
7
-
8
-
9
-
10
-
11
-
12
-
13
-
14
-
15
-
16
-
17
-
18
-
19
-
20
-
21
-
22
-
23
-
24
-
25
-
26
-
27
-
28
-
29
-
30
-
31
-
32
-
33
-
34
-
35
-
36
-
37
-
38
-
39
-
40
-
41
-
42
-
43
-
44
-
45
-
46
-
47
-
48
-
49
-
50
-
51
-
52
-
53
-
54
-
55
-
56
-
57
-
58
-
59
-
60
-
61
-
62
-
63
-
64
-
65
-
66
-
67
-
68
-
69
-
70
-
71
-
72
-
73
-
74
-
75
-
76
-
77
-
78
-
79
-
80
-
81
-
82
-
83
-
84
-
85
-
86
-
87
-
88
-
89
-
90
-
91
-
92
-
93
-
94
-
95
-
96
-
97
-
98
-
99
-
100
-
101
-
102
-
103
-
104
-
105
-
106
-
107
-
108
-
109
-
110
-
111
-
112
-
113
-
114
-
115
-
116
-
117
-
118
-
119
-
120
-
121
-
122
-
123
-
124
-
125
-
126
-
127
-
128
-
129
-
130
-
131
-
132
-
133
-
134
-
135
-
136
-
137
-
138
-
139
-
140
-
141
-
142
-
143
-
144
-
145
-
146
-
147
-
148
-
149
-
150
-
151
-
152
-
153
-
154
-
155
-
156
-
157
-
158
-
159
-
160
-
161
-
162
-
163
-
164
-
165
-
166
-
167
-
168
-
 169
169 -
 170
170 -
 171
171 -
 172
172 -
 173
173 -
 174
174 -
 175
175 -
 176
176 -
 177
177 -
 178
178 -
 179
179 -
 180
180 -
 181
181 -
 182
182 -
 183
183 -
 184
184 -
 185
185 -
 186
186 -
 187
187 -
 188
188 -
 189
189 -
190
-
191
-
192
-
193
-
194
-
195
-
196
-
197
-
198
-
199
-
200
-
201
-
202
-
203
-
204
-
205
-
206
-
207
-
208
-
209
-
210
-
211
-
212
-
213
-
214
-
215
-
216
-
217
-
218
-
219
-
220
-
221
-
222
-
223
-
224
-
225
-
226
-
227
-
228
 |
 |

13 Company financial statements 13.4 - 13.4 A B C D
Annual Report 2011 179
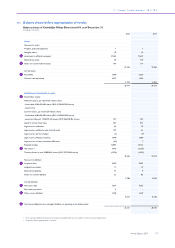
13.4 Notes
All amounts in millions of euros unless otherwise stated
Notes to the Company financial statements
AInvestments in affiliated companies
The investments in affiliated companies (including goodwill) are
presented in the balance sheet based on either their net asset value in
accordance with the aforementioned accounting principles of the
consolidated financial statements, or at amortized cost.
investments
in Group
companies1)
investments
in associates loans total
Balance as of January
1, 2011 19,256 80 1,724 21,060
Changes:
Reclassifications − 1 − 1
Acquisitions/
additions 734 28 285 1,047
Sales/redemptions (137) − (249) (386)
Net income from
affiliated companies (1,237) 10 − (1,227)
Dividends received (454) (27) − (481)
Translation
differences 59 3 (6) 56
Other (469) − − (469)
Balance as of
December 31, 2011 17,752 95 1,754 19,601
1) Prior period insignificant amounts have been reclassified due to new insights
in line with accounting policies
A list of subsidiaries and affiliated companies, prepared in accordance
with the relevant legal requirements (Dutch Civil Code, Book 2,
Sections 379 and 414), is deposited at the Chamber of Commerce in
Eindhoven, Netherlands.
Included in Other, under Investments in affiliated companies, are
actuarial gains and losses of EUR 447 million related to defined-
benefit plans of group companies.
BOther non-current financial assets
available-
for-sale
financial
assets
loans and
receivables
financial
assets at
fair value
through
profit and
loss total
Balance as of January 1,
2011 108 1 − 109
Changes:
Reclassifications (1) − − (1)
Acquisitions/additions 22 24 − 46
Sales/redemptions/
reductions (12) − − (12)
Value adjustments (29) − 8 (21)
Impairments (7) − − (7)
Balance as of December
31, 2011 81 25 8 114
Available-for-sale financial assets
The Company’s investments in available-for-sale financial assets mainly
consists of investments in common stock of companies in various
industries.
Loans and receivables
The increase of loans and receivables in 2011 mainly related to the loan
given to Philips Sport Vereniging (PSV).
Financial assets at fair value through profit and loss
On September 7, 2010, Philips sold its entire holding of common shares
in NXP Semiconductors B.V. (NXP) to Philips Pension Trustees Limited
(herein after referred to as “UK Pension Fund”). As a result of this
transaction the UK Pension fund obtained the full legal title and
ownership of the NXP shares, including the entitlement to any future
dividends and the proceeds from any sale of shares. From the date of
the transaction the NXP shares are an integral part of the plan assets
of the UK Pension Fund. The purchase agreement with the UK Pension
Fund includes an arrangement that may entitle Philips to a cash payment
from the UK Pension Fund on or after September 7, 2014, if the value of
the NXP shares has increased by this date to a level in excess of a
predetermined threshold, which at the time of the transaction was
substantially above the transaction price, and the UK Pension Fund is
in a surplus (on the regulatory funding basis) on September 7, 2014.
The arrangement qualifies as a financial instrument and is reported
under financial assets at fair value through profit and loss. The fair value
of the arrangement was estimated to be zero as of December 31, 2010.
As of December 31, 2011, management’s best estimate of the fair value
of the arrangement is EUR 8 million, based on the risks, the stock price
of NXP, the current progress and the long-term nature of the recovery
plan of the UK Pension Fund. The change in fair value until December
31, 2011, is reported under value adjustments in the table above.
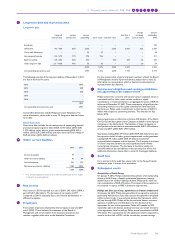
CReceivables
2010 2011
Trade accounts receivable 106 85
Affiliated companies 1,261 2,679
Other receivables 28 27
Advances and prepaid expenses 43 36
Derivative instruments - assets 230 379
1,668 3,206
In 2011, receivables increased by EUR 1,538 million, which largely
relates to increased receivables with affiliated companies of EUR 1,418
million as a result of increased financing towards these companies to
meet their cash flow requirements. This movement is also partially
reflected within the Company’s cash and cash equivalents position,
which fell by EUR 2,527 million.
DShareholders’ equity
Common shares
As of December 31, 2011, the issued and fully paid share capital consists
of 1,008,975,445 common shares, each share having a par value of EUR
0.20.
In May 2011, Philips settled a dividend of EUR 0.75 per common share,
representing a total value of EUR 711 million. Shareholders could elect
for a cash dividend or a share dividend. Approximately 63% of the
shareholders elected for a share dividend, resulting in the issuance of
22,896,661 new common shares. The settlement of the cash dividend
resulted in a payment of EUR 263 million.
Preference shares
The ‘Stichting Preferente Aandelen Philips’ has been granted the right
to acquire preference shares in the Company. Such right has not been
exercised. As a means to protect the Company and its stakeholders
against an unsolicited attempt to (de facto) take over control of the
Company, the General Meeting of Shareholders in 1989 adopted
amendments to the Company’s articles of association that allow the
Board of Management and the Supervisory Board to issue (rights to
acquire) preference shares to a third party. As of December 31, 2011,
no preference shares have been issued.
Option rights/restricted shares
The Company has granted stock options on its common shares and
rights to receive common shares in the future. Please refer to note 30,
Share-based compensation, which is deemed incorporated and
repeated herein by reference.