Philips 2011 Annual Report Download - page 119
Download and view the complete annual report
Please find page 119 of the 2011 Philips annual report below. You can navigate through the pages in the report by either clicking on the pages listed below, or by using the keyword search tool below to find specific information within the annual report.-
 1
1 -
2
-
3
-
4
-
5
-
6
-
7
-
8
-
9
-
10
-
11
-
12
-
13
-
14
-
15
-
16
-
17
-
18
-
19
-
20
-
21
-
22
-
23
-
24
-
25
-
26
-
27
-
28
-
29
-
30
-
31
-
32
-
33
-
34
-
35
-
36
-
37
-
38
-
39
-
40
-
41
-
42
-
43
-
44
-
45
-
46
-
47
-
48
-
49
-
50
-
51
-
52
-
53
-
54
-
55
-
56
-
57
-
58
-
59
-
60
-
61
-
62
-
63
-
64
-
65
-
66
-
67
-
68
-
69
-
70
-
71
-
72
-
73
-
74
-
75
-
76
-
77
-
78
-
79
-
80
-
81
-
82
-
83
-
84
-
85
-
86
-
87
-
88
-
89
-
90
-
91
-
92
-
93
-
94
-
95
-
96
-
97
-
98
-
99
-
100
-
101
-
102
-
103
-
104
-
105
-
106
-
107
-
108
-
 109
109 -
 110
110 -
 111
111 -
 112
112 -
 113
113 -
 114
114 -
 115
115 -
 116
116 -
 117
117 -
 118
118 -
 119
119 -
 120
120 -
 121
121 -
 122
122 -
 123
123 -
 124
124 -
 125
125 -
 126
126 -
 127
127 -
 128
128 -
 129
129 -
130
-
131
-
132
-
133
-
134
-
135
-
136
-
137
-
138
-
139
-
140
-
141
-
142
-
143
-
144
-
145
-
146
-
147
-
148
-
149
-
150
-
151
-
152
-
153
-
154
-
155
-
156
-
157
-
158
-
159
-
160
-
161
-
162
-
163
-
164
-
165
-
166
-
167
-
168
-
169
-
170
-
171
-
172
-
173
-
174
-
175
-
176
-
177
-
178
-
179
-
180
-
181
-
182
-
183
-
184
-
185
-
186
-
187
-
188
-
189
-
190
-
191
-
192
-
193
-
194
-
195
-
196
-
197
-
198
-
199
-
200
-
201
-
202
-
203
-
204
-
205
-
206
-
207
-
208
-
209
-
210
-
211
-
212
-
213
-
214
-
215
-
216
-
217
-
218
-
219
-
220
-
221
-
222
-
223
-
224
-
225
-
226
-
227
-
228
 |
 |

12 Group financial statements 12.4 - 12.4
Annual Report 2011 119
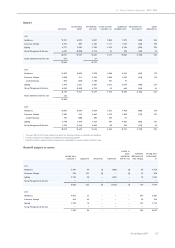
12.4 Consolidated statements of income
in millions of euros unless otherwise stated
Consolidated statements of income of the Philips Group for the years ended December 31
2009 2010 2011
Sales 20,092 22,287 22,579
Cost of sales (12,519) (13,191) (13,932)
Gross margin 7,573 9,096 8,647
Selling expenses (4,703) (4,876) (5,160)
General and administrative expenses (721) (713) (841)
Research and development expenses (1,542) (1,493) (1,610)
Impairment of goodwill − − (1,355)
Other business income 95 93 125
Other business expenses (42) (27) (75)
Income from operations
1660 2,080 (269)
Financial income
2225 214 112
Financial expenses
2(387) (335) (352)
Income before taxes 498 1,959 (509)
Income tax expense
3(99) (499) (283)
Income (loss) after taxes 399 1,460 (792)
Results relating to investments in associates:
4
- Company’s participation in income 23 14 18
- Other results 54 4 (2)
Income (loss) from continuing operations 476 1,478 (776)
Discontinued operations - net of income tax
5(52) (26) (515)
Net income (loss) 424 1,452 (1,291)
Attribution of net income (loss)
Net income (loss) attributable to shareholders 410 1,446 (1,295)
Net income (loss) attributable to non-controlling interests 14 6 4
Earnings per common share attributable to shareholders
2009 2010 2011
Basic earnings per common share in euros
Income (loss) from continuing operations attributable to shareholders
60.50 1.57 (0.82)
Net income (loss) attributable to shareholders
60.44 1.54 (1.36)
Diluted earnings per common share in euros
Income (loss) from continuing operations attributable to shareholders
60.50 1.55 (0.82)
Net income (loss) attributable to shareholders
60.44 1.52 (1.36)
The years 2009 and 2010 are restated to present the Television business as discontinued operations.
The accompanying notes are an integral part of these consolidated financial statements.