Philips 2011 Annual Report Download - page 36
Download and view the complete annual report
Please find page 36 of the 2011 Philips annual report below. You can navigate through the pages in the report by either clicking on the pages listed below, or by using the keyword search tool below to find specific information within the annual report.-
 1
1 -
2
-
3
-
4
-
5
-
6
-
7
-
8
-
9
-
10
-
11
-
12
-
13
-
14
-
15
-
16
-
17
-
18
-
19
-
20
-
21
-
22
-
23
-
24
-
25
-
 26
26 -
 27
27 -
 28
28 -
 29
29 -
 30
30 -
 31
31 -
 32
32 -
 33
33 -
 34
34 -
 35
35 -
 36
36 -
 37
37 -
 38
38 -
 39
39 -
 40
40 -
 41
41 -
 42
42 -
 43
43 -
 44
44 -
 45
45 -
 46
46 -
47
-
48
-
49
-
50
-
51
-
52
-
53
-
54
-
55
-
56
-
57
-
58
-
59
-
60
-
61
-
62
-
63
-
64
-
65
-
66
-
67
-
68
-
69
-
70
-
71
-
72
-
73
-
74
-
75
-
76
-
77
-
78
-
79
-
80
-
81
-
82
-
83
-
84
-
85
-
86
-
87
-
88
-
89
-
90
-
91
-
92
-
93
-
94
-
95
-
96
-
97
-
98
-
99
-
100
-
101
-
102
-
103
-
104
-
105
-
106
-
107
-
108
-
109
-
110
-
111
-
112
-
113
-
114
-
115
-
116
-
117
-
118
-
119
-
120
-
121
-
122
-
123
-
124
-
125
-
126
-
127
-
128
-
129
-
130
-
131
-
132
-
133
-
134
-
135
-
136
-
137
-
138
-
139
-
140
-
141
-
142
-
143
-
144
-
145
-
146
-
147
-
148
-
149
-
150
-
151
-
152
-
153
-
154
-
155
-
156
-
157
-
158
-
159
-
160
-
161
-
162
-
163
-
164
-
165
-
166
-
167
-
168
-
169
-
170
-
171
-
172
-
173
-
174
-
175
-
176
-
177
-
178
-
179
-
180
-
181
-
182
-
183
-
184
-
185
-
186
-
187
-
188
-
189
-
190
-
191
-
192
-
193
-
194
-
195
-
196
-
197
-
198
-
199
-
200
-
201
-
202
-
203
-
204
-
205
-
206
-
207
-
208
-
209
-
210
-
211
-
212
-
213
-
214
-
215
-
216
-
217
-
218
-
219
-
220
-
221
-
222
-
223
-
224
-
225
-
226
-
227
-
228
 |
 |
5 Group performance 5.1 - 5.1.2
36 Annual Report 2011
below the level of 2010, due to lower cash flow from
operating activities, lower proceeds from the sale of
stakes and interests, and higher outflow related to
acquisitions of new businesses and capital expenditures.
• In July 2011 we launched a EUR 2 billion share buy-
back program aimed at improving the efficiency of our
balance sheet. By the end of the year we had completed
35% of this program.
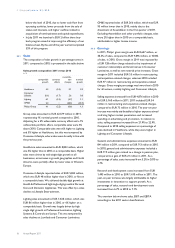
5.1.1 Sales
The composition of sales growth in percentage terms in
2011, compared to 2010, is presented in the table below.
Sales growth composition 2011 versus 2010
in %
comparable
growth
currency
effects
consolida-
tion
changes
nominal
growth
Healthcare 5.3 (2.5) 0.1 2.9
Consumer
Lifestyle (0.1) (1.7) 2.6 0.8
Lighting 6.1 (2.3) (2.7) 1.1
GM&S 2.4 − (28.3) (25.9)
Philips Group 4.1 (2.2) (0.6) 1.3
Group sales amounted to EUR 22,579 million in 2011,
representing 1% nominal growth compared to 2010.
Adjusting for a 2% unfavorable currency effect and a 1%
unfavorable portfolio effect, comparable sales were 4%
above 2010. Comparable sales were 6% higher at Lighting
and 5% higher at Healthcare, but this was tempered by
Consumer Lifestyle, where sales were broadly in line with
the previous year.
Healthcare sales amounted to EUR 8,852 million, which
was 5% higher than in 2010 on a comparable basis. Higher
sales were driven by mid-single-digit growth at all
businesses, as increases in growth geographies and North
America were partially offset by lower sales in Western
Europe.
Consumer Lifestyle reported sales of EUR 5,823 million,
which was EUR 48 million higher than in 2010, or flat on
a comparable basis. We achieved double-digit growth at
Health & Wellness and high single-digit growth at Personal
Care and Domestic Appliances. This was offset by a sales
decline at Lifestyle Entertainment.
Lighting sales amounted to EUR 7,638 million, which was
EUR 86 million higher than in 2010, or 6% higher on a
comparable basis. Growth was largely driven by high
single digit growth at Professional Luminaires, Lighting
Systems & Controls and Lamps. This was tempered by
sales declines at Lumileds and Consumer Luminaires.
GM&S reported sales of EUR 266 million, which was EUR
93 million lower than in 2010, mainly due to the
divestment of Assembléon in the first quarter of 2011.
Excluding Assembléon and other portfolio changes, sales
were 2% higher than in 2010 on a comparable basis,
attributable to higher license income.
5.1.2 Earnings
In 2011, Philips’ gross margin was EUR 8,647 million, or
38.3% of sales, compared to EUR 9,096 million, or 40.8%
of sales, in 2010. Gross margin in 2011 was impacted by
a EUR 128 million charge related to the impairment of
customer relationships and brand names in Consumer
Luminaires, as well as raw material price increases. Gross
margin in 2011 included EUR 53 million in restructuring
and acquisition-related charges, whereas 2010 included
EUR 97 million in restructuring and acquisition-related
charges. Gross margin percentage was lower than in 2010
for all sectors, notably Lighting and Consumer Lifestyle.
Selling expenses increased from EUR 4,876 million in 2010
to EUR 5,160 million in 2011. 2011 included EUR 54
million in restructuring and acquisition-related charges,
compared to EUR 75 million in 2010. The year-on-year
increase was mainly attributable to higher expenses aimed
at driving higher market penetration and increased
spending on advertising and promotion. In relation to
sales, selling expenses increased from 21.9% to 22.9%.
Compared to 2010 selling expenses as a percentage of
sales declined in Healthcare, while they were higher in
Lighting and Consumer Lifestyle.
General and administrative expenses amounted to EUR
841 million in 2011, compared to EUR 713 million in 2010.
In 2010, general and administrative expenses included a
EUR 119 million gain related to a change in pension plan,
compared to a gain of EUR 21 million in 2011. As a
percentage of sales, costs increased from 3.2% in 2010 to
3.7%.
Research and development costs increased from EUR
1,493 million in 2010 to EUR 1,610 million in 2011. The
year-on-year increase was largely attributable to higher
investments in innovation to support growth. As a
percentage of sales, research and development costs
increased from 6.7% in 2010 to 7.1%.
The overview below shows sales, EBIT and EBITA
according to the 2011 sector classifications.