Philips 2011 Annual Report Download - page 189
Download and view the complete annual report
Please find page 189 of the 2011 Philips annual report below. You can navigate through the pages in the report by either clicking on the pages listed below, or by using the keyword search tool below to find specific information within the annual report.-
 1
1 -
2
-
3
-
4
-
5
-
6
-
7
-
8
-
9
-
10
-
11
-
12
-
13
-
14
-
15
-
16
-
17
-
18
-
19
-
20
-
21
-
22
-
23
-
24
-
25
-
26
-
27
-
28
-
29
-
30
-
31
-
32
-
33
-
34
-
35
-
36
-
37
-
38
-
39
-
40
-
41
-
42
-
43
-
44
-
45
-
46
-
47
-
48
-
49
-
50
-
51
-
52
-
53
-
54
-
55
-
56
-
57
-
58
-
59
-
60
-
61
-
62
-
63
-
64
-
65
-
66
-
67
-
68
-
69
-
70
-
71
-
72
-
73
-
74
-
75
-
76
-
77
-
78
-
79
-
80
-
81
-
82
-
83
-
84
-
85
-
86
-
87
-
88
-
89
-
90
-
91
-
92
-
93
-
94
-
95
-
96
-
97
-
98
-
99
-
100
-
101
-
102
-
103
-
104
-
105
-
106
-
107
-
108
-
109
-
110
-
111
-
112
-
113
-
114
-
115
-
116
-
117
-
118
-
119
-
120
-
121
-
122
-
123
-
124
-
125
-
126
-
127
-
128
-
129
-
130
-
131
-
132
-
133
-
134
-
135
-
136
-
137
-
138
-
139
-
140
-
141
-
142
-
143
-
144
-
145
-
146
-
147
-
148
-
149
-
150
-
151
-
152
-
153
-
154
-
155
-
156
-
157
-
158
-
159
-
160
-
161
-
162
-
163
-
164
-
165
-
166
-
167
-
168
-
169
-
170
-
171
-
172
-
173
-
174
-
175
-
176
-
177
-
178
-
 179
179 -
 180
180 -
 181
181 -
 182
182 -
 183
183 -
 184
184 -
 185
185 -
 186
186 -
 187
187 -
 188
188 -
 189
189 -
 190
190 -
 191
191 -
 192
192 -
 193
193 -
 194
194 -
 195
195 -
 196
196 -
 197
197 -
 198
198 -
 199
199 -
200
-
201
-
202
-
203
-
204
-
205
-
206
-
207
-
208
-
209
-
210
-
211
-
212
-
213
-
214
-
215
-
216
-
217
-
218
-
219
-
220
-
221
-
222
-
223
-
224
-
225
-
226
-
227
-
228
 |
 |

14 Sustainability statements 14.3 - 14.3
Annual Report 2011 189
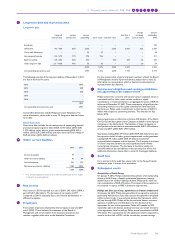
Green Manufacturing 20151)
parameters
2015 target
(%
)
2011 actual
(%
)
Total CO2 from manufacturing (25) (12)
Water (10) 3
Materials provided for recycling via external
contractor per total waste 80 77
Restricted substances:
Benzene emission (50) 6
Mercury emission (100) (73)
CFCs, HCFCs (100) (97)
Other restricted substances (excluding
CFCs from cooling systems) (90) (14)
Hazardous substances:
Lead emission (100) (98)
PFCs (35) 20
Toluene emission (90) 160
Xylene emission (90) 741
Styrene (90) (75)
Antimony, Arsenic and their compounds (100) 106
1) Total reduction targets against the base year 2007
Energy use in manufacturing
Total energy usage in manufacturing amounted to 13,982 terajoules in
2011, of which Lighting consumes about 80%. Compared with 2010,
energy consumption at Philips went down by 3%. This was driven by
organizational changes, energy efficiency improvements, less load in
glass furnaces and production mix changes.
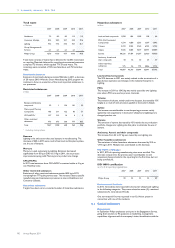
Total energy consumption in manufacturing
in terajoules
2007 2008 2009 2010 2011
Healthcare 1,602 1,612 1,670 1,545 1,541
Consumer Lifestyle 1,451 1,521 1,188 1,274 1,252
Lighting 12,053 11,359 11,535 11,580 11,189
Group Management &
Services 35 34 28 27 −
Philips Group 15,141 14,526 14,421 14,426 13,982
Carbon emissions in manufacturing
The greenhouse gas emissions of our manufacturing operations totaled
635 kilotons CO2-equivalent in 2011, 6% lower than 2010. Both direct
and indirect CO2 emissions decreased, mainly as a result of the change
in the industrial footprint, energy efficiency improvement and an
increased share of electricity generated by renewable sources.
Total carbon emissions in manufacturing
in kilotons CO2-equivalent
2007 2008 2009 2010 2011
Direct CO21) 323 303 298 302 297
Indirect CO2470 430 439 313 269
Other greenhouse gases 41 61 54 34 41
From glass production 29 28 24 25 28
Philips Group 863 822 815 674 635
1) From energy
CO2 emissions decreased at all sectors due to energy efficiency
improvements and an increased share of electricity generated by
renewable sources. Lighting achieved additional reductions in CO2
emissions due to changes in the industrial footprint.
Total carbon emissions in manufacturing per sector
in kilotons CO2-equivalent
2007 2008 2009 2010 2011
Healthcare 118 120 118 57 54
Consumer Lifestyle 65 65 49 39 37
Lighting 678 636 647 577 544
Group Management &
Services 2 1 1 1 −
Philips Group 863 822 815 674 635
Water usage in manufacturing
Total water intake in 2011 was 4.3 million m3, about 3% higher than in
2010. This increase was mainly due to a change in the manufacturing
process at a major Lighting site, coupled with 2 new acquisitions that
started to report in 2011. Lighting represents about 85% of total water
usage. In this sector, water is used in manufacturing as well as for
domestic purpose. The other sectors use water mainly for domestic
purposes.
Water intake
in thousands m3
2007 2008 2009 2010 2011
Healthcare 369 370 363 256 308
Consumer Lifestyle 485 452 315 351 338
Lighting 3,350 3,168 3,531 3,604 3,682
Group Management &
Services 5 6 7 7 −
Philips Group 4,209 3,996 4,216 4,218 4,328
In 2011, 74% of water was purchased and 26% was extracted from
groundwater wells.
Waste in manufacturing
Total waste decreased 10% to 94 kilotons in 2011 from 105 kilotons
in 2010. Lighting (69%) and Consumer Lifestyle (21%) account for 90%
of our total waste. The reduction was due to the closure of a glass
furnace and organizational changes in Consumer Lifestyle and Lighting.