Philips 2011 Annual Report Download - page 211
Download and view the complete annual report
Please find page 211 of the 2011 Philips annual report below. You can navigate through the pages in the report by either clicking on the pages listed below, or by using the keyword search tool below to find specific information within the annual report.-
 1
1 -
2
-
3
-
4
-
5
-
6
-
7
-
8
-
9
-
10
-
11
-
12
-
13
-
14
-
15
-
16
-
17
-
18
-
19
-
20
-
21
-
22
-
23
-
24
-
25
-
26
-
27
-
28
-
29
-
30
-
31
-
32
-
33
-
34
-
35
-
36
-
37
-
38
-
39
-
40
-
41
-
42
-
43
-
44
-
45
-
46
-
47
-
48
-
49
-
50
-
51
-
52
-
53
-
54
-
55
-
56
-
57
-
58
-
59
-
60
-
61
-
62
-
63
-
64
-
65
-
66
-
67
-
68
-
69
-
70
-
71
-
72
-
73
-
74
-
75
-
76
-
77
-
78
-
79
-
80
-
81
-
82
-
83
-
84
-
85
-
86
-
87
-
88
-
89
-
90
-
91
-
92
-
93
-
94
-
95
-
96
-
97
-
98
-
99
-
100
-
101
-
102
-
103
-
104
-
105
-
106
-
107
-
108
-
109
-
110
-
111
-
112
-
113
-
114
-
115
-
116
-
117
-
118
-
119
-
120
-
121
-
122
-
123
-
124
-
125
-
126
-
127
-
128
-
129
-
130
-
131
-
132
-
133
-
134
-
135
-
136
-
137
-
138
-
139
-
140
-
141
-
142
-
143
-
144
-
145
-
146
-
147
-
148
-
149
-
150
-
151
-
152
-
153
-
154
-
155
-
156
-
157
-
158
-
159
-
160
-
161
-
162
-
163
-
164
-
165
-
166
-
167
-
168
-
169
-
170
-
171
-
172
-
173
-
174
-
175
-
176
-
177
-
178
-
179
-
180
-
181
-
182
-
183
-
184
-
185
-
186
-
187
-
188
-
189
-
190
-
191
-
192
-
193
-
194
-
195
-
196
-
197
-
198
-
199
-
200
-
 201
201 -
 202
202 -
 203
203 -
 204
204 -
 205
205 -
 206
206 -
 207
207 -
 208
208 -
 209
209 -
 210
210 -
 211
211 -
 212
212 -
 213
213 -
 214
214 -
 215
215 -
 216
216 -
 217
217 -
 218
218 -
 219
219 -
 220
220 -
 221
221 -
222
-
223
-
224
-
225
-
226
-
227
-
228
 |
 |

16 Five-year overview 16 - 16
Annual Report 2011 211
Capital employed 20071) 2008 2009 2010 2011
Cash and cash equivalents 8,769 3,620 4,386 5,833 3,147
Receivables and other current assets 5,292 5,038 4,610 4,899 5,157
Assets classified as held for sale 319 − − 120 551
Inventories 3,213 3,491 2,913 3,865 3,625
Non-current financial assets/investments in associates 5,000 1,624 972 660 549
Non-current receivables/assets 3,959 2,884 2,871 1,514 1,911
Property, plant and equipment 3,194 3,496 3,252 3,145 3,014
Intangible assets 6,635 11,757 11,523 12,233 11,012
Total assets 36,381 31,910 30,527 32,269 28,966
Property, plant and equipment:
Capital expenditures for the year 658 770 495 621 725
Depreciation for the year 509 662 702 644 634
Capital expenditures : depreciation 1.2 1.1 0.7 1.0 1.1
Inventories as a % of sales 12.0 13.2 14.5 17.3 16.1
Outstanding trade receivables, in days sales 44 42 40 46 46
Financial structure 20071) 2008 2009 2010 2011
Other liabilities 8,469 9,292 9,166 10,180 10,017
Liabilities directly associated with assets held for sale 78 − − − 61
Debt 3,563 4,188 4,267 4,658 3,860
Provisions 2,403 2,837 2,450 2,339 2,639
Total provisions and liabilities 14,513 16,317 15,883 17,177 16,577
Shareholders’ equity 21,741 15,544 14,595 15,046 12,355
Non-controlling interests 127 49 49 46 34
Group equity and liabilities 36,381 31,910 30,527 32,269 28,966
Net debt : group equity ratio (31):131 4:96 (1):101 (8):108 5:95
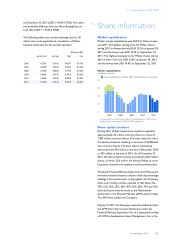
Market capitalization at year-end 31,436 12,765 19,180 21,694 15,077