Philips 2011 Annual Report Download - page 162
Download and view the complete annual report
Please find page 162 of the 2011 Philips annual report below. You can navigate through the pages in the report by either clicking on the pages listed below, or by using the keyword search tool below to find specific information within the annual report.-
 1
1 -
2
-
3
-
4
-
5
-
6
-
7
-
8
-
9
-
10
-
11
-
12
-
13
-
14
-
15
-
16
-
17
-
18
-
19
-
20
-
21
-
22
-
23
-
24
-
25
-
26
-
27
-
28
-
29
-
30
-
31
-
32
-
33
-
34
-
35
-
36
-
37
-
38
-
39
-
40
-
41
-
42
-
43
-
44
-
45
-
46
-
47
-
48
-
49
-
50
-
51
-
52
-
53
-
54
-
55
-
56
-
57
-
58
-
59
-
60
-
61
-
62
-
63
-
64
-
65
-
66
-
67
-
68
-
69
-
70
-
71
-
72
-
73
-
74
-
75
-
76
-
77
-
78
-
79
-
80
-
81
-
82
-
83
-
84
-
85
-
86
-
87
-
88
-
89
-
90
-
91
-
92
-
93
-
94
-
95
-
96
-
97
-
98
-
99
-
100
-
101
-
102
-
103
-
104
-
105
-
106
-
107
-
108
-
109
-
110
-
111
-
112
-
113
-
114
-
115
-
116
-
117
-
118
-
119
-
120
-
121
-
122
-
123
-
124
-
125
-
126
-
127
-
128
-
129
-
130
-
131
-
132
-
133
-
134
-
135
-
136
-
137
-
138
-
139
-
140
-
141
-
142
-
143
-
144
-
145
-
146
-
147
-
148
-
149
-
150
-
151
-
 152
152 -
 153
153 -
 154
154 -
 155
155 -
 156
156 -
 157
157 -
 158
158 -
 159
159 -
 160
160 -
 161
161 -
 162
162 -
 163
163 -
 164
164 -
 165
165 -
 166
166 -
 167
167 -
 168
168 -
 169
169 -
 170
170 -
 171
171 -
 172
172 -
173
-
174
-
175
-
176
-
177
-
178
-
179
-
180
-
181
-
182
-
183
-
184
-
185
-
186
-
187
-
188
-
189
-
190
-
191
-
192
-
193
-
194
-
195
-
196
-
197
-
198
-
199
-
200
-
201
-
202
-
203
-
204
-
205
-
206
-
207
-
208
-
209
-
210
-
211
-
212
-
213
-
214
-
215
-
216
-
217
-
218
-
219
-
220
-
221
-
222
-
223
-
224
-
225
-
226
-
227
-
228
 |
 |

30 12 Group financial statements 12.11 - 12.11
162 Annual Report 2011
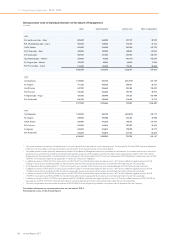
Movements in the net liability for other defined-benefit obligations:
2010 2011
Defined-benefit obligation at the beginning of year 295 297
Service cost 2 1
Interest cost 20 17
Actuarial (gains) or losses (11) (30)
Plan amendments − −
Curtailment gains (9) −
Changes in consolidation − −
Benefits paid (25) (17)
Exchange rate differences 24 1
Miscellaneous 1 −
Defined-benefit obligation at end of year 297 269
Present value of funded obligations at end of year − −
Present value of unfunded obligations at end of year 297 269
Funded status (297) (269)
Unrecognized prior-service cost (21) (17)
Net balances (318) (286)
Classification of the net balance is as follows:
Provision for other postretirement benefits (318) (286)
Other postretirement benefit expense recognized in the Consolidated
statements of income:
2009 2010 2011
Service cost 2 2 1
Interest cost on accumulated
postretirement benefits 32 20 17
Prior-service cost (1) (2) (2)
Curtailment loss (gain) (134) (9) −
Other 1 − −
(100) 11 16
Amounts recognized in the Consolidated statements of comprehensive
income:
2009 2010 2011
Actuarial (gains) losses 63 (11) (30)
Total recognized in net periodic pension
cost and Consolidated statements of
comprehensive income (37) − (14)
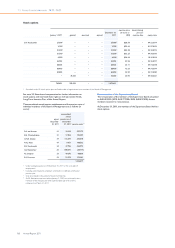
The expense for other postretirement benefits is recognized in the
following line items in the Consolidated statements of income:
2009 2010 2011
Cost of sales 2 (7) 2
Selling expenses (1) 1 1
General and administrative expenses (101) 17 13
(100) 11 16
The weighted average assumptions used to calculate the
postretirement benefit obligations other than pensions as of December
31 were as follows:
2010 2011
Discount rate 6.6% 5.1%
Compensation increase (where applicable) − −
The weighted average assumptions used to calculate the net cost for
years ended December 31:
2010 2011
Discount rate 6.7% 6.6%
Compensation increase (where applicable) − −
Assumed healthcare cost trend rates at December 31:
2010 2011
Healthcare cost trend rate assumed for next year 8.4% 8.3%
Rate that the cost trend rate will gradually reach 4.8% 4.4%
Year of reaching the rate at which it is assumed to
remain 2018 2018
Sensitivity analysis
Assumed healthcare trend rates can have a significant effect on the
amounts reported for the retiree medical plans. A one percentage-
point change in assumed healthcare cost trend rates would have the
following effects as at December 31:
2010 2011
increase
of 1%
decrease
of 1%
increase
of 1%
decrease
of 1%
Effect on total of
service and interest cost 1 (1) 1 (1)
Effect on postretirement
benefit obligation 19 (17) 16 (14)
Historical data
2007 2008 2009 2010 2011
Present value of defined-
benefit obligation 413 353 295 297 269
Fair value of plan assets − − − − −
(Deficit) (413) (353) (295) (297) (269)
Experience adjustments in
% on defined-benefit
obligations; (gains) and
losses 0.2% 0.1% 4.9% (8.1%) (9.4%)
30 Share-based compensation
The Company has granted stock options on its common shares and
rights to receive common shares in the future (restricted share rights)
to members of the Board of Management and other members of the
Executive Committee, Philips executives and certain selected
employees. The purpose of the share-based compensation plans is to
align the interests of management with those of shareholders by
providing incentives to improve the Company’s performance on a long-
term basis, thereby increasing shareholder value. Under the Company’s
plans, options are granted at fair market value on the date of grant.