Philips 2011 Annual Report Download - page 152
Download and view the complete annual report
Please find page 152 of the 2011 Philips annual report below. You can navigate through the pages in the report by either clicking on the pages listed below, or by using the keyword search tool below to find specific information within the annual report.-
 1
1 -
2
-
3
-
4
-
5
-
6
-
7
-
8
-
9
-
10
-
11
-
12
-
13
-
14
-
15
-
16
-
17
-
18
-
19
-
20
-
21
-
22
-
23
-
24
-
25
-
26
-
27
-
28
-
29
-
30
-
31
-
32
-
33
-
34
-
35
-
36
-
37
-
38
-
39
-
40
-
41
-
42
-
43
-
44
-
45
-
46
-
47
-
48
-
49
-
50
-
51
-
52
-
53
-
54
-
55
-
56
-
57
-
58
-
59
-
60
-
61
-
62
-
63
-
64
-
65
-
66
-
67
-
68
-
69
-
70
-
71
-
72
-
73
-
74
-
75
-
76
-
77
-
78
-
79
-
80
-
81
-
82
-
83
-
84
-
85
-
86
-
87
-
88
-
89
-
90
-
91
-
92
-
93
-
94
-
95
-
96
-
97
-
98
-
99
-
100
-
101
-
102
-
103
-
104
-
105
-
106
-
107
-
108
-
109
-
110
-
111
-
112
-
113
-
114
-
115
-
116
-
117
-
118
-
119
-
120
-
121
-
122
-
123
-
124
-
125
-
126
-
127
-
128
-
129
-
130
-
131
-
132
-
133
-
134
-
135
-
136
-
137
-
138
-
139
-
140
-
141
-
 142
142 -
 143
143 -
 144
144 -
 145
145 -
 146
146 -
 147
147 -
 148
148 -
 149
149 -
 150
150 -
 151
151 -
 152
152 -
 153
153 -
 154
154 -
 155
155 -
 156
156 -
 157
157 -
 158
158 -
 159
159 -
 160
160 -
 161
161 -
 162
162 -
163
-
164
-
165
-
166
-
167
-
168
-
169
-
170
-
171
-
172
-
173
-
174
-
175
-
176
-
177
-
178
-
179
-
180
-
181
-
182
-
183
-
184
-
185
-
186
-
187
-
188
-
189
-
190
-
191
-
192
-
193
-
194
-
195
-
196
-
197
-
198
-
199
-
200
-
201
-
202
-
203
-
204
-
205
-
206
-
207
-
208
-
209
-
210
-
211
-
212
-
213
-
214
-
215
-
216
-
217
-
218
-
219
-
220
-
221
-
222
-
223
-
224
-
225
-
226
-
227
-
228
 |
 |

19 12 Group financial statements 12.11 - 12.11
152 Annual Report 2011
included under revaluation reserves of EUR 70 million (2010: EUR 86
million), retained earnings of EUR 1,089 million (2010: EUR 1,078
million) and other reserves of EUR 52 million (2010: EUR 139 million).
In general, gains related to currency translation differences, available-
for-sale financial assets and cash flow hedges cannot be distributed as
part of shareholders’ equity as they form part of the legal reserves
protected under Dutch law. By their nature, losses relating to currency
translation differences, available-for-sale financial assets and cash flow
hedges reduce shareholders’ equity, and thereby distributable amounts.
Therefore, gains related to currency translation differences (2011: EUR
7 million) and available-for-sale financial assets (2011: EUR 45 million)
included in other reserves limit the distribution of shareholders’ equity.
The losses related to cash flow hedges (2011: EUR 9 million) reduce
the distributable amount by their nature.
The legal reserve required by Dutch law of EUR 1,089 million (2010:
EUR 1,078 million) included under retained earnings relates to any legal
or economic restrictions on the ability of affiliated companies to
transfer funds to the parent company in the form of dividends.
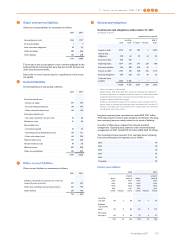
19 Long-term debt and short-term debt
Long-term debt
(range of)
interest rates
average rate of
interest
amount
outstanding due in 1 year due after 1 year due after 5 years
average
remaining term
(in years)
amount
outstanding
2010
Eurobonds − − − − − − − 750
USD bonds 4.6 - 7.8% 6.2% 2,505 − 2,505 2,007 12.2 2,687
Convertible
debentures − − 23 23 − − − 38
Private financing 1.0 - 2.0% − 1 1 − − 1.1 1
Bank borrowings 2.8 - 12.4% 5.5% 627 − 627 202 4.5 268
Finance leases 1.1 - 16.1% 1.7% 204 59 145 31 3.7 164
Other long-term
debt 2.3 - 19.0% 4.7% 57 56 1 − 4.0 64
3,417 139 3,278 2,240 3,972
Corresponding
data of previous
year 5.5% 3,972 1,154 2,818 1,986 3,786
The following amounts of long-term debt as of December 31, 2011, are
due in the next five years:
2012 139
2013 723
2014 285
2015 20
2016 10
Total 1,177
Corresponding amount of previous year 1,986
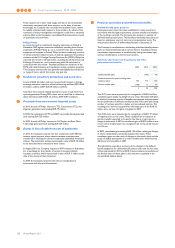
effective
rate 2010 2011
Unsecured Eurobonds
Due 5/16/11; 6 1/8% 6.122% 750 −
Unsecured USD Bonds
Due 5/15/25; 7 3/4% 7.429% 74 77
Due 6/01/26; 7 1/5% 6.885% 124 128
Due 8/15/13; 7 1/4% 6.382% 107 110
Due 5/15/25; 7 1/8% 6.794% 77 79
Due 03/11/11; 3 3/8%1) 3.128% 262 −
Due 03/11/13; 4 5/8%1) 4.949% 374 386
Due 03/11/18; 5 3/4%1) 6.066% 935 966
Due 03/11/38; 6 7/8%1) 7.210% 748 773
Adjustments2) (14) (14)
2,687 2,505
1) The provisions applicable to these bonds, issued in March 2008, contain a
‘Change of Control Triggering Event’. If the Company would experience such
an event with respect to a series of corporate bonds, the Company may be
required to offer to purchase the bonds of the series at a purchase price
equal to 101% of the principal amount, plus accrued and unpaid interest, if any.
2) Adjustments relate to issued bond discounts, transaction costs and fair value
adjustments for interest rate derivatives