Philips 2011 Annual Report Download - page 49
Download and view the complete annual report
Please find page 49 of the 2011 Philips annual report below. You can navigate through the pages in the report by either clicking on the pages listed below, or by using the keyword search tool below to find specific information within the annual report.-
 1
1 -
2
-
3
-
4
-
5
-
6
-
7
-
8
-
9
-
10
-
11
-
12
-
13
-
14
-
15
-
16
-
17
-
18
-
19
-
20
-
21
-
22
-
23
-
24
-
25
-
26
-
27
-
28
-
29
-
30
-
31
-
32
-
33
-
34
-
35
-
36
-
37
-
38
-
 39
39 -
 40
40 -
 41
41 -
 42
42 -
 43
43 -
 44
44 -
 45
45 -
 46
46 -
 47
47 -
 48
48 -
 49
49 -
 50
50 -
 51
51 -
 52
52 -
 53
53 -
 54
54 -
 55
55 -
 56
56 -
 57
57 -
 58
58 -
 59
59 -
60
-
61
-
62
-
63
-
64
-
65
-
66
-
67
-
68
-
69
-
70
-
71
-
72
-
73
-
74
-
75
-
76
-
77
-
78
-
79
-
80
-
81
-
82
-
83
-
84
-
85
-
86
-
87
-
88
-
89
-
90
-
91
-
92
-
93
-
94
-
95
-
96
-
97
-
98
-
99
-
100
-
101
-
102
-
103
-
104
-
105
-
106
-
107
-
108
-
109
-
110
-
111
-
112
-
113
-
114
-
115
-
116
-
117
-
118
-
119
-
120
-
121
-
122
-
123
-
124
-
125
-
126
-
127
-
128
-
129
-
130
-
131
-
132
-
133
-
134
-
135
-
136
-
137
-
138
-
139
-
140
-
141
-
142
-
143
-
144
-
145
-
146
-
147
-
148
-
149
-
150
-
151
-
152
-
153
-
154
-
155
-
156
-
157
-
158
-
159
-
160
-
161
-
162
-
163
-
164
-
165
-
166
-
167
-
168
-
169
-
170
-
171
-
172
-
173
-
174
-
175
-
176
-
177
-
178
-
179
-
180
-
181
-
182
-
183
-
184
-
185
-
186
-
187
-
188
-
189
-
190
-
191
-
192
-
193
-
194
-
195
-
196
-
197
-
198
-
199
-
200
-
201
-
202
-
203
-
204
-
205
-
206
-
207
-
208
-
209
-
210
-
211
-
212
-
213
-
214
-
215
-
216
-
217
-
218
-
219
-
220
-
221
-
222
-
223
-
224
-
225
-
226
-
227
-
228
 |
 |

5 Group performance 5.3.2 - 5.3.3
Annual Report 2011 49
Healthcare leadership positions. It also showed an
improvement in performance at Healthcare and
Consumer Lifestyle in the US, our largest healthcare
market. In Europe, Philips showed a mixed performance,
with gains in LED lighting in Germany, and a decline at
Healthcare in France. Looking ahead to 2012 and beyond,
the company will continue to use NPS as a measure of
customer experience. In line with its Accelerate!
transformation aimed at winning customers in its markets
and the pursuit of excellence in the marketplace, it will
focus on outright NPS leadership relative to competition,
as well as its own absolute position with customers.
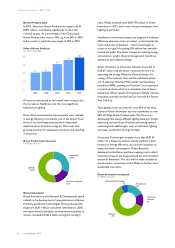
Marketing expenses
in millions of euros ■-in value----as a % of sales
1,200
900
600
300
0
4.3
892
2007
3.8
832
2008
3.6
714
2009
3.7
835
2010
4.2
938
2011
5.3.2 Research & development
R&D spending increased as a percentage of sales from
6.7% in 2010 to 7.1%. Philips has continued to expand its
vast knowledge and intellectual property base. Early and
continuous involvement of customers in new
technologies, application and business concepts ensures
deep insight into their needs – the foundation for our
innovations. Innovation leading to new businesses in
incubators and internal ventures and Emerging Business
Areas is managed separately from the traditional business
to ensure focus on these growth initiatives. The
effectiveness of innovation has been improved by
streamlining our organization in Corporate Technologies,
leading to more focus, alignment and enhanced offering of
value propositions. The scope of the new organization
covers front end innovation, i.e. early innovation and pre-
development activities, supplemented by small series
production. Within the Accelerate! program this
approach started to show results in terms of increased
speed to market.
Research and development expenses
in millions of euros ■-in value----as a % of sales
2,000
1,500
1,000
500
0
7.3
1,508
2007
7.8
1,684
2008
7.7
1,542
2009
6.7
1,493
2010
7.1
1,610
2011
Healthcare R&D spend has increased substantially by EUR
42 million, to drive co-leadership in Imaging Systems and
leadership in Patient Care and Clinical Informatics. Also,
in Consumer Lifestyle we increased the R&D spend by
EUR 31 million, to drive category leadership in Male
Grooming, Oral Healthcare, Kitchen Appliances and
Coffee. In Lighting, we increased our R&D investment by
15% or EUR 54 million compared to 2010, to accelerate
transformation to LED, applications and solutions, to
maintain our leadership position in LED lighting
innovation (e.g. L-prize), and to ensure maintenance of
our lead over competition, including our leading IP
position. In GM&S, R&D expenses were reduced by EUR
10 million, creating more focus.
Research and development expenses per sector
in millions of euros
2009 2010 2011
Healthcare 679 698 740
Consumer Lifestyle 300 282 313
Lighting 351 355 409
Group Management & Services 212 158 148
Philips Group 1,542 1,493 1,610
5.3.3 Supply management
The Supply organization encompasses four functions:
Commercial Supply Chain, Customer Service, Operations
and Purchasing. Collectively, they represent around
61,000 Philips employees and are responsible for
sourcing, manufacturing and delivering products and
solutions.
Management of shortages and management
of commodity price increases
The recovery of the global economy led to tight supply of
semiconductor components, in particular, in the course
of 2011. The scarcity of and increased prices for
commodities like copper and phosphor led to upward
price pressure. We were largely able to negotiate price