Philips 2011 Annual Report Download - page 52
Download and view the complete annual report
Please find page 52 of the 2011 Philips annual report below. You can navigate through the pages in the report by either clicking on the pages listed below, or by using the keyword search tool below to find specific information within the annual report.-
 1
1 -
2
-
3
-
4
-
5
-
6
-
7
-
8
-
9
-
10
-
11
-
12
-
13
-
14
-
15
-
16
-
17
-
18
-
19
-
20
-
21
-
22
-
23
-
24
-
25
-
26
-
27
-
28
-
29
-
30
-
31
-
32
-
33
-
34
-
35
-
36
-
37
-
38
-
39
-
40
-
41
-
 42
42 -
 43
43 -
 44
44 -
 45
45 -
 46
46 -
 47
47 -
 48
48 -
 49
49 -
 50
50 -
 51
51 -
 52
52 -
 53
53 -
 54
54 -
 55
55 -
 56
56 -
 57
57 -
 58
58 -
 59
59 -
 60
60 -
 61
61 -
 62
62 -
63
-
64
-
65
-
66
-
67
-
68
-
69
-
70
-
71
-
72
-
73
-
74
-
75
-
76
-
77
-
78
-
79
-
80
-
81
-
82
-
83
-
84
-
85
-
86
-
87
-
88
-
89
-
90
-
91
-
92
-
93
-
94
-
95
-
96
-
97
-
98
-
99
-
100
-
101
-
102
-
103
-
104
-
105
-
106
-
107
-
108
-
109
-
110
-
111
-
112
-
113
-
114
-
115
-
116
-
117
-
118
-
119
-
120
-
121
-
122
-
123
-
124
-
125
-
126
-
127
-
128
-
129
-
130
-
131
-
132
-
133
-
134
-
135
-
136
-
137
-
138
-
139
-
140
-
141
-
142
-
143
-
144
-
145
-
146
-
147
-
148
-
149
-
150
-
151
-
152
-
153
-
154
-
155
-
156
-
157
-
158
-
159
-
160
-
161
-
162
-
163
-
164
-
165
-
166
-
167
-
168
-
169
-
170
-
171
-
172
-
173
-
174
-
175
-
176
-
177
-
178
-
179
-
180
-
181
-
182
-
183
-
184
-
185
-
186
-
187
-
188
-
189
-
190
-
191
-
192
-
193
-
194
-
195
-
196
-
197
-
198
-
199
-
200
-
201
-
202
-
203
-
204
-
205
-
206
-
207
-
208
-
209
-
210
-
211
-
212
-
213
-
214
-
215
-
216
-
217
-
218
-
219
-
220
-
221
-
222
-
223
-
224
-
225
-
226
-
227
-
228
 |
 |

5 Group performance 5.4.1 - 5.4.1
52 Annual Report 2011
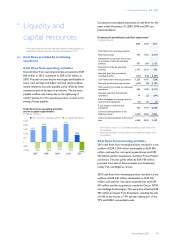
Green Product sales
In 2011, sales from Green Products increased to EUR
8,805 million, contributing significantly to the total
revenue stream. As a percentage of the Group total,
Green Product sales rose to 39%, up from 36% in 2010,
and on track to reach the new target of 50% in 2015.
Sales of Green Products
as a % of total sales
40
30
20
10
0
21
2007
22
2008
31
2009
36
2010
39
2011
All sectors contributed to the overall sales increase, but
the increase at Healthcare was the most significant,
followed by Lighting.
Most of the environmental improvements were realized
in energy efficiency of products, one of the Green Focal
Areas in our EcoDesign process and an important
objective of our EcoVision program. There was also
growing attention for substances of concern and recycling
in all sectors.
Green Product sales by sector
in millions of euros
Healthcare
2,663
Consumer Lifestyle
1,571
Lighting
4,571
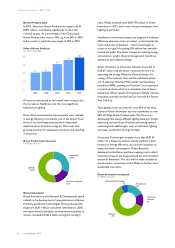
Green Innovation
Green Innovation is the Research & Development spend
related to the development of new generations of Green
Products and Green Technologies. Having achieved the
target of a EUR 1 billion cumulative investment in 2010,
two years ahead of schedule, we then announced plans to
invest a cumulative EUR 2 billion during the coming 5
years. Philips invested some EUR 470 million in Green
Innovation in 2011, with a very strong contribution from
Lighting in particular.
Healthcare’s innovation projects are targeted at making a
difference wherever care is provided − in the hospital, the
home and points in-between − which has brought us
closer to our goal of touching 500 million lives annually
around the globe. The sector focuses on reducing energy
consumption, weight, lifecycle management, hazardous
substances and radiation dosage.
Green Innovation at Consumer Lifestyle amounted to
EUR 67 million and the sector continued its work on
improving the energy efficiency of the products, the
closing of the materials loop and the voluntarily phase-
out of polyvinyl chloride (PVC) and brominated flame
retardants (BFR), enabling our Personal Care businesses
to launch products which are completely free of these
substances. Other results of Consumer Lifestyle’s Green
Innovation activities are the EcoCare Iron and the Senseo
Viva Café Eco.
The Lighting sector accounts for over 60% of the total
spend on Green Innovation and also contributes to over
50% of Philips Green Product sales. The focus is on
developing new energy-efficient lighting solutions, further
enhancing current Green Products and driving toward
technological breakthroughs, such as solid-state lighting
and water purification through UV light.
Corporate Technologies invested more than EUR 36
million on a Green Innovation activity portfolio mainly
focused on energy efficiency, care and the reduction of
waste and water consumption. Philips Research
developed an EcoVision portfolio mapping tool in which
innovation projects are mapped along the environmental
and social dimension. The tool will be made available to
the innovation community within Philips to further drive
sustainable innovation.
Green Innovation investment
in millions of euros
Healthcare
85
Consumer
Lifestyle
67
Lighting
291
Corporate Technologies
36