Philips 2011 Annual Report Download - page 214
Download and view the complete annual report
Please find page 214 of the 2011 Philips annual report below. You can navigate through the pages in the report by either clicking on the pages listed below, or by using the keyword search tool below to find specific information within the annual report.-
 1
1 -
2
-
3
-
4
-
5
-
6
-
7
-
8
-
9
-
10
-
11
-
12
-
13
-
14
-
15
-
16
-
17
-
18
-
19
-
20
-
21
-
22
-
23
-
24
-
25
-
26
-
27
-
28
-
29
-
30
-
31
-
32
-
33
-
34
-
35
-
36
-
37
-
38
-
39
-
40
-
41
-
42
-
43
-
44
-
45
-
46
-
47
-
48
-
49
-
50
-
51
-
52
-
53
-
54
-
55
-
56
-
57
-
58
-
59
-
60
-
61
-
62
-
63
-
64
-
65
-
66
-
67
-
68
-
69
-
70
-
71
-
72
-
73
-
74
-
75
-
76
-
77
-
78
-
79
-
80
-
81
-
82
-
83
-
84
-
85
-
86
-
87
-
88
-
89
-
90
-
91
-
92
-
93
-
94
-
95
-
96
-
97
-
98
-
99
-
100
-
101
-
102
-
103
-
104
-
105
-
106
-
107
-
108
-
109
-
110
-
111
-
112
-
113
-
114
-
115
-
116
-
117
-
118
-
119
-
120
-
121
-
122
-
123
-
124
-
125
-
126
-
127
-
128
-
129
-
130
-
131
-
132
-
133
-
134
-
135
-
136
-
137
-
138
-
139
-
140
-
141
-
142
-
143
-
144
-
145
-
146
-
147
-
148
-
149
-
150
-
151
-
152
-
153
-
154
-
155
-
156
-
157
-
158
-
159
-
160
-
161
-
162
-
163
-
164
-
165
-
166
-
167
-
168
-
169
-
170
-
171
-
172
-
173
-
174
-
175
-
176
-
177
-
178
-
179
-
180
-
181
-
182
-
183
-
184
-
185
-
186
-
187
-
188
-
189
-
190
-
191
-
192
-
193
-
194
-
195
-
196
-
197
-
198
-
199
-
200
-
201
-
202
-
203
-
 204
204 -
 205
205 -
 206
206 -
 207
207 -
 208
208 -
 209
209 -
 210
210 -
 211
211 -
 212
212 -
 213
213 -
 214
214 -
 215
215 -
 216
216 -
 217
217 -
 218
218 -
 219
219 -
 220
220 -
 221
221 -
 222
222 -
 223
223 -
 224
224 -
225
-
226
-
227
-
228
 |
 |

17 Investor Relations 17.1 - 17.1
214 Annual Report 2011
Koninklijke Philips Electronics N.V. at Euronext
Amsterdam on 23, 24 and 25 May, 2012. The Company
will calculate the number of share dividend rights entitled
to one new common share, such that the gross dividend
in shares will be approximately 3% higher than the gross
dividend in cash. Payment of the dividend and delivery of
new common shares, with settlement of fractions in cash,
if required, will take place from May 30, 2012. The
distribution of dividend in cash to holders of New York
registry shares will be made in USD at the USD/EUR rate
fixed by the European Central Bank on May 28, 2012.
Dividend in cash is in principle subject to 15% Dutch
dividend withholding tax, which will be deducted from the
dividend in cash paid to the shareholders. Dividend in
shares paid out of earnings and retained earnings is subject
to 15% dividend withholding tax, but only in respect of the
par value of the shares (EUR 0.20 per share). This
withholding tax in the case of dividend in shares will be
borne by Philips.
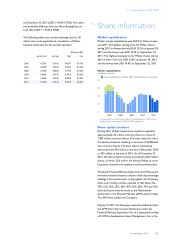
In 2011, a dividend of EUR 0.75 per common share was
paid in cash or shares, at the option of the shareholder.
Approximately 63% elected for a share dividend resulting
in the issuance of 22,896,661 new common shares, leading
to a 2.4% dilution. The remainder of the dividend was paid
in cash (EUR 259 million) against the net income of the
Company.
ex-dividend
date record date payment date
Amsterdam
shares May 2, 2012 May 4, 2012 May 30, 2012
New York
shares May 2, 2012 May 4, 2012 May 30, 2012
Dividend and dividend yield per common share
■-dividend per share in euros----yield in %1)
1.00
0.80
0.60
0.40
0.20
0
1.1
0.36
2002
2.2
0.36
2003
1.6
0.36
2004
2.1
0.40
2005
1.7
0.44
2006
2.1
0.60
2007
2.4
0.70
2008
5.1
0.70
2009
3.4
0.70
2010
3.3
0.75
2011
4.6
0.75
20122)
1) Dividend yield % is as of December 31 of previous year
2) Subject to approval by the 2012 Annual General Meeting of Shareholders
Information for US investors
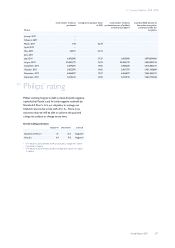
Dividends and distributions per Common Share
The following table sets forth in euros the gross dividends
on the Common Shares in the fiscal years indicated (from
prior-year profit distribution) and such amounts as
converted into US dollars and paid to holders of Shares
of the New York registry:
2007 2008 2009 2010 2011
in EUR 0.60 0.70 0.70 0.70 0.75
in USD 0.80 1.09 0.94 0.93 1.11
Exchange rates USD : EUR
The following two tables set forth, for the periods and
dates indicated, certain information concerning the
exchange rate for US dollars into euros based on the
Noon Buying Rate in New York City for cable transfers
in foreign currencies as certified for customs purposes by
the Federal Reserve Bank of New York (the “Noon
Buying Rate”). The Noon Buying Rate on February 17,
2012 was EUR 0.7605 per USD 1.
calendar
period EUR per USD
period end average high low
2006 0.7577 0.7906 0.8432 0.7504
2007 0.6848 0.7259 0.7750 0.6729
2008 0.7184 0.6844 0.8035 0.6246
2009 0.6977 0.7187 0.7970 0.6623
2010 0.7536 0.7579 0.8362 0.6879
2011 0.7708 0.7186 0.7736 0.6723
highest rate lowest rate
August, 2011 0.7063 0.6892
September, 2011 0.7437 0.7001
October, 2011 0.7530 0.7056
November, 2011 0.7551 0.7245
December, 2011 0.7736 0.7415
January, 2012 0.7885 0.7580
Philips publishes its financial statements in euros while a
substantial portion of its net assets, earnings and sales are
denominated in other currencies. Philips conducts its
business in more than 50 different currencies.
Unless otherwise stated, for the convenience of the
reader the translations of euros into US dollars appearing
in this report have been made based on the closing rate