Philips 2011 Annual Report Download - page 53
Download and view the complete annual report
Please find page 53 of the 2011 Philips annual report below. You can navigate through the pages in the report by either clicking on the pages listed below, or by using the keyword search tool below to find specific information within the annual report.-
 1
1 -
2
-
3
-
4
-
5
-
6
-
7
-
8
-
9
-
10
-
11
-
12
-
13
-
14
-
15
-
16
-
17
-
18
-
19
-
20
-
21
-
22
-
23
-
24
-
25
-
26
-
27
-
28
-
29
-
30
-
31
-
32
-
33
-
34
-
35
-
36
-
37
-
38
-
39
-
40
-
41
-
42
-
 43
43 -
 44
44 -
 45
45 -
 46
46 -
 47
47 -
 48
48 -
 49
49 -
 50
50 -
 51
51 -
 52
52 -
 53
53 -
 54
54 -
 55
55 -
 56
56 -
 57
57 -
 58
58 -
 59
59 -
 60
60 -
 61
61 -
 62
62 -
 63
63 -
64
-
65
-
66
-
67
-
68
-
69
-
70
-
71
-
72
-
73
-
74
-
75
-
76
-
77
-
78
-
79
-
80
-
81
-
82
-
83
-
84
-
85
-
86
-
87
-
88
-
89
-
90
-
91
-
92
-
93
-
94
-
95
-
96
-
97
-
98
-
99
-
100
-
101
-
102
-
103
-
104
-
105
-
106
-
107
-
108
-
109
-
110
-
111
-
112
-
113
-
114
-
115
-
116
-
117
-
118
-
119
-
120
-
121
-
122
-
123
-
124
-
125
-
126
-
127
-
128
-
129
-
130
-
131
-
132
-
133
-
134
-
135
-
136
-
137
-
138
-
139
-
140
-
141
-
142
-
143
-
144
-
145
-
146
-
147
-
148
-
149
-
150
-
151
-
152
-
153
-
154
-
155
-
156
-
157
-
158
-
159
-
160
-
161
-
162
-
163
-
164
-
165
-
166
-
167
-
168
-
169
-
170
-
171
-
172
-
173
-
174
-
175
-
176
-
177
-
178
-
179
-
180
-
181
-
182
-
183
-
184
-
185
-
186
-
187
-
188
-
189
-
190
-
191
-
192
-
193
-
194
-
195
-
196
-
197
-
198
-
199
-
200
-
201
-
202
-
203
-
204
-
205
-
206
-
207
-
208
-
209
-
210
-
211
-
212
-
213
-
214
-
215
-
216
-
217
-
218
-
219
-
220
-
221
-
222
-
223
-
224
-
225
-
226
-
227
-
228
 |
 |

5 Group performance 5.4.1 - 5.4.3
Annual Report 2011 53
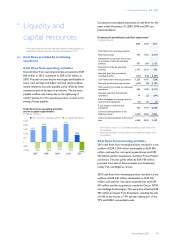
Operational carbon footprint and energy efficiency
In 2011, we took another step towards reaching our
target of 25% CO2 reduction by 2012, as operational CO2
emissions decreased 4%. CO2 emissions from
manufacturing decreased 8% due to a number of reasons,
including our ongoing energy efficiency program, the
changing industrial footprint and the increase in purchased
electricity from renewable sources. CO2 emissions from
non-industrial sites decreased 2%, partly because of our
continued focus on the most efficient use of facility space,
for instance with our Work Place Innovation program
(which enables flex-working), but also due to the
increased share of purchased electricity from renewable
sources.
As a result of our green lease car policy, our lease car fleet
continues to become more CO2 efficient. Consequently,
the average CO2 per kilometer further decreased 8%
compared to last year. Total emissions from business
travel increased, however, due to a higher number of
airplane travel movements. We continue to promote
video conferencing as an alternative to travel. CO2
emissions from logistics decreased 2%, because of our
continued focus on efficient container utilization, reducing
mileage in road freight, and the shift from air to sea freight,
which is cleaner and more cost effective.
Our operational energy efficiency improved 4%, from 1.29
terajoules per million euro sales in 2010 to 1.24 terajoules
per million euro sales in 2011.
Operational carbon footprint
in kilotons CO2-equivalent ■-logistics_■-business travel
■-non-industrial operations_■-manufacturing
2,500
2,000
1,500
1,000
500
0
2007
714
276
211
947
2,148
2008
706
265
181
959
2,111
2009
627
220
174
909
1,930
2010
672
247
159
767
1,845
2011
657
256
155
703
1,771
Carbon emissions in our Supply Chain
In 2011, we also performed a study to quantify the CO2
emissions of our total supply chain which allows us to
target our carbon reduction actions. Total emissions in
the supply chain were estimated at 5.6 million tons.
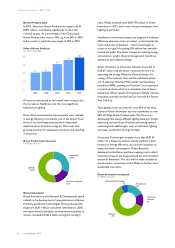
Operational energy efficiency
in terajoules per million euro sales
1.50
1.00
0.50
0
1.29
2007
1.28
2008
1.34
2009
1.29
2010
1.24
2011
5.4.2 Green Manufacturing 2015
We developed our Green Manufacturing 2015 program
in 2010 as we wanted to continue our efforts to improve
our environmental performance in manufacturing. The
program focuses on most contributors to climate change,
recycling of waste, reduction of water consumption and
reduction of restricted and hazardous substances.
Full details, including our 2015 targets, can be found in
chapter 14, Sustainability statements, of this Annual
Report.
5.4.3 Social performance
Employee engagement
In 2011, 87% of our employees took part in the
Engagement Survey. The Employee Engagement Index –
the single measure of the overall level of employee
engagement at Philips – reached 76%, marking a 1 point
decrease. The target for 2011 was to maintain the EEI at
the external high-performance benchmark level of 77%.
Employee Engagement Index
% favorable
80
60
40
20
0
67
2007
72
2008
71
2009
77
2010
76
2011
Equally important is the insight we gained into ways in
which we can improve. For 2012, the focus will be put on
improving the engagement level within customer facing
functions and in the area of confidence and trust.