Philips 2011 Annual Report Download - page 155
Download and view the complete annual report
Please find page 155 of the 2011 Philips annual report below. You can navigate through the pages in the report by either clicking on the pages listed below, or by using the keyword search tool below to find specific information within the annual report.-
 1
1 -
2
-
3
-
4
-
5
-
6
-
7
-
8
-
9
-
10
-
11
-
12
-
13
-
14
-
15
-
16
-
17
-
18
-
19
-
20
-
21
-
22
-
23
-
24
-
25
-
26
-
27
-
28
-
29
-
30
-
31
-
32
-
33
-
34
-
35
-
36
-
37
-
38
-
39
-
40
-
41
-
42
-
43
-
44
-
45
-
46
-
47
-
48
-
49
-
50
-
51
-
52
-
53
-
54
-
55
-
56
-
57
-
58
-
59
-
60
-
61
-
62
-
63
-
64
-
65
-
66
-
67
-
68
-
69
-
70
-
71
-
72
-
73
-
74
-
75
-
76
-
77
-
78
-
79
-
80
-
81
-
82
-
83
-
84
-
85
-
86
-
87
-
88
-
89
-
90
-
91
-
92
-
93
-
94
-
95
-
96
-
97
-
98
-
99
-
100
-
101
-
102
-
103
-
104
-
105
-
106
-
107
-
108
-
109
-
110
-
111
-
112
-
113
-
114
-
115
-
116
-
117
-
118
-
119
-
120
-
121
-
122
-
123
-
124
-
125
-
126
-
127
-
128
-
129
-
130
-
131
-
132
-
133
-
134
-
135
-
136
-
137
-
138
-
139
-
140
-
141
-
142
-
143
-
144
-
 145
145 -
 146
146 -
 147
147 -
 148
148 -
 149
149 -
 150
150 -
 151
151 -
 152
152 -
 153
153 -
 154
154 -
 155
155 -
 156
156 -
 157
157 -
 158
158 -
 159
159 -
 160
160 -
 161
161 -
 162
162 -
 163
163 -
 164
164 -
 165
165 -
166
-
167
-
168
-
169
-
170
-
171
-
172
-
173
-
174
-
175
-
176
-
177
-
178
-
179
-
180
-
181
-
182
-
183
-
184
-
185
-
186
-
187
-
188
-
189
-
190
-
191
-
192
-
193
-
194
-
195
-
196
-
197
-
198
-
199
-
200
-
201
-
202
-
203
-
204
-
205
-
206
-
207
-
208
-
209
-
210
-
211
-
212
-
213
-
214
-
215
-
216
-
217
-
218
-
219
-
220
-
221
-
222
-
223
-
224
-
225
-
226
-
227
-
228
 |
 |

12 Group financial statements 12.11 - 12.11 21 22 23 24
Annual Report 2011 155
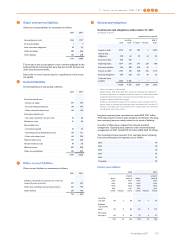
21 Other non-current liabilities
Other non-current liabilities are summarized as follows:
2010 2011
Accrued pension costs 1,044 1,191
Income tax payable 1 1
Asset retirement obligations 28 23
Other tax liability 483 566
Other liabilities 158 218
1,714 1,999
The increase in the accrued pension costs is mainly attributable to the
funding of the US and Switzerland plans. See also note 29, Pensions and
other postretirement benefits.
Please refer to note 3, Income taxes for a specification of the income
tax payable.
22 Accrued liabilities
Accrued liabilities are summarized as follows:
2010 2011
Personnel-related costs:
- Salaries and wages 474 459
- Accrued holiday entitlements 184 193
- Other personnel-related costs 196 159
Fixed-asset-related costs:
- Gas, water, electricity, rent and other 70 62
Distribution costs 91 96
Sales-related costs:
- Commission payable 56 62
- Advertising and marketing-related costs 139 121
- Other sales-related costs 145 236
Material-related costs 197 200
Interest-related accruals 87 65
Deferred income 807 878
Other accrued liabilities 549 495
2,995 3,026
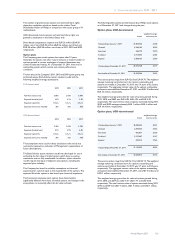
23 Other current liabilities
Other current liabilities are summarized as follows:
2010 2011
Advances received from customers on orders not
covered by work in process 291 293
Other taxes including social security premiums 227 143
Other liabilities 236 198
754 634
24 Contractual obligations
Contractual cash obligations at December 31, 2011
in millions of euros1)
payments due by period
total
less than
1 year 1-3 years 3-5 years
after 5
years
Long-term debt 3,213 80 923 1 2,209
Finance lease
obligations 218 60 90 33 35
Short-term debt 443 443 − − −
Operating leases 1,017 242 371 224 180
Derivative liabilities 749 208 474 67 −
Interest on debt2) 1,737 138 268 215 1,116
Purchase obligations3) 505 242 211 29 23
Trade and other
payables 3,346 3,346 − − −
11,228 4,759 2,337 569 3,563
1) Data in this table is undiscounted
2) Approximately 27% of the debt bears interest at a floating rate. Majority of
the interest payments on variable interest rate loans in the table above reflect
market forward interest rates at the period end and these amounts may
change as market interest rate changes
3) Philips has commitments related to the ordinary course of business which in
general relate to contracts and purchase order commitments for less than 12
months. In the table, only the commitments for multiple years are presented,
including their short-term portion
Long-term operating lease commitments totaled EUR 1,017 million.
These leases expire at various dates during the next 20 years. The long-
term operating leases are mainly related to the rental of buildings.
A number of these leases originate from sale-and-leaseback
arrangements. Operating lease payments under sale-and-leaseback
arrangements for 2011 totaled EUR 16 million (2010: EUR 16 million).
The remaining minimum payments from operating leases originating
from sale-and-leaseback arrangements are as follows:
2012 18
2013 18
2014 18
2015 14
2016 13
Thereafter 39
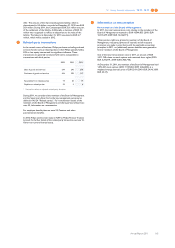
Finance lease liabilities
2010 2011
future
mini-
mum
lease
pay-
ments interest
present
value of
mini-
mum
lease
pay-
ments
future
mini-
mum
lease
pay-
ments interest
present
value of
mini-
mum
lease
pay-
ments
Less than
one year 44 1 43 60 1 59
Between
one and five
years 94 9 85 123 9 114
More than
five years 40 4 36 35 4 31
178 14 164 218 14 204