Philips 2011 Annual Report Download - page 146
Download and view the complete annual report
Please find page 146 of the 2011 Philips annual report below. You can navigate through the pages in the report by either clicking on the pages listed below, or by using the keyword search tool below to find specific information within the annual report.-
 1
1 -
2
-
3
-
4
-
5
-
6
-
7
-
8
-
9
-
10
-
11
-
12
-
13
-
14
-
15
-
16
-
17
-
18
-
19
-
20
-
21
-
22
-
23
-
24
-
25
-
26
-
27
-
28
-
29
-
30
-
31
-
32
-
33
-
34
-
35
-
36
-
37
-
38
-
39
-
40
-
41
-
42
-
43
-
44
-
45
-
46
-
47
-
48
-
49
-
50
-
51
-
52
-
53
-
54
-
55
-
56
-
57
-
58
-
59
-
60
-
61
-
62
-
63
-
64
-
65
-
66
-
67
-
68
-
69
-
70
-
71
-
72
-
73
-
74
-
75
-
76
-
77
-
78
-
79
-
80
-
81
-
82
-
83
-
84
-
85
-
86
-
87
-
88
-
89
-
90
-
91
-
92
-
93
-
94
-
95
-
96
-
97
-
98
-
99
-
100
-
101
-
102
-
103
-
104
-
105
-
106
-
107
-
108
-
109
-
110
-
111
-
112
-
113
-
114
-
115
-
116
-
117
-
118
-
119
-
120
-
121
-
122
-
123
-
124
-
125
-
126
-
127
-
128
-
129
-
130
-
131
-
132
-
133
-
134
-
135
-
 136
136 -
 137
137 -
 138
138 -
 139
139 -
 140
140 -
 141
141 -
 142
142 -
 143
143 -
 144
144 -
 145
145 -
 146
146 -
 147
147 -
 148
148 -
 149
149 -
 150
150 -
 151
151 -
 152
152 -
 153
153 -
 154
154 -
 155
155 -
 156
156 -
157
-
158
-
159
-
160
-
161
-
162
-
163
-
164
-
165
-
166
-
167
-
168
-
169
-
170
-
171
-
172
-
173
-
174
-
175
-
176
-
177
-
178
-
179
-
180
-
181
-
182
-
183
-
184
-
185
-
186
-
187
-
188
-
189
-
190
-
191
-
192
-
193
-
194
-
195
-
196
-
197
-
198
-
199
-
200
-
201
-
202
-
203
-
204
-
205
-
206
-
207
-
208
-
209
-
210
-
211
-
212
-
213
-
214
-
215
-
216
-
217
-
218
-
219
-
220
-
221
-
222
-
223
-
224
-
225
-
226
-
227
-
228
 |
 |

8 12 Group financial statements 12.11 - 12.11
146 Annual Report 2011
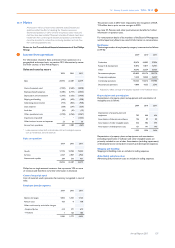
8Property, plant and equipment
land and buildings
machinery and
installations other equipment
prepayments and
construction in
progress total
Balance as of January 1, 2011:
Cost 2,273 3,851 1,715 273 8,112
Accumulated depreciation (964) (2,684) (1,319) − (4,967)
Book value 1,309 1,167 396 273 3,145
Change in book value:
Capital expenditures 16 140 103 486 745
Assets available for use 49 216 117 (382) −
Acquisitions 1 11 2 2 16
Disposals and sales (58) (12) (12) (3) (85)
Depreciation (84) (350) (166) − (600)
Impairments (13) (16) (14) (2) (45)
Transfer to assets classified as held for sale (157) (10) (17) (16) (200)
Reclassifications 11 − − − 11
Translation differences 12 6 2 7 27
Total changes (223) (15) 15 92 (131)
Balance as of December 31, 2011:
Cost 1,981 3,930 1,552 365 7,828
Accumulated depreciation (895) (2,778) (1,141) − (4,814)
Book value 1,086 1,152 411 365 3,014
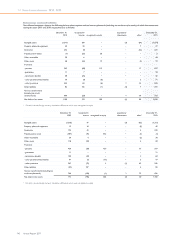
land and buildings
machinery and
installations other equipment
prepayments and
construction in
progress total
Balance as of January 1, 2010:
Cost 2,447 3,692 1,708 207 8,054
Accumulated depreciation (1,013) (2,518) (1,271) − (4,802)
Book value 1,434 1,174 437 207 3,252
Change in book value:
Capital expenditures 67 134 24 428 653
Assets available for use 24 212 126 (362) −
Acquisitions 1 2 5 (1) 7
Disposals and sales (32) (32) (19) (4) (87)
Depreciation (95) (357) (176) − (628)
Impairments (18) (12) (20) − (50)
Transfer to assets classified as held for sale (120) − − − (120)
Translation differences 48 46 19 5 118
Total changes (125) (7) (41) 66 (107)
Balance as of December 31, 2010:
Cost 2,273 3,851 1,715 273 8,112
Accumulated depreciation (964) (2,684) (1,319) − (4,967)
Book value 1,309 1,167 396 273 3,145
Land with a book value of EUR 180 million at December 31, 2011 (2010:
EUR 193 million) is not depreciated.
Property, plant and equipment includes lease assets with a book value
of EUR 196 million at December 31, 2011 (2010: EUR 156 million). The
total book value of assets no longer productively employed, mainly
included in land and buildings, amounted to EUR 11 million at
December 31, 2011 (2010: EUR 15 million).
The expected useful lives of property, plant and equipment are as
follows:
Buildings from 5 to 50 years
Machinery and installations from 3 to 20 years
Lease assets from 1 to 15 years
Other equipment from 1 to 10 years