Philips 2011 Annual Report Download - page 70
Download and view the complete annual report
Please find page 70 of the 2011 Philips annual report below. You can navigate through the pages in the report by either clicking on the pages listed below, or by using the keyword search tool below to find specific information within the annual report.-
 1
1 -
2
-
3
-
4
-
5
-
6
-
7
-
8
-
9
-
10
-
11
-
12
-
13
-
14
-
15
-
16
-
17
-
18
-
19
-
20
-
21
-
22
-
23
-
24
-
25
-
26
-
27
-
28
-
29
-
30
-
31
-
32
-
33
-
34
-
35
-
36
-
37
-
38
-
39
-
40
-
41
-
42
-
43
-
44
-
45
-
46
-
47
-
48
-
49
-
50
-
51
-
52
-
53
-
54
-
55
-
56
-
57
-
58
-
59
-
 60
60 -
 61
61 -
 62
62 -
 63
63 -
 64
64 -
 65
65 -
 66
66 -
 67
67 -
 68
68 -
 69
69 -
 70
70 -
 71
71 -
 72
72 -
 73
73 -
 74
74 -
 75
75 -
 76
76 -
 77
77 -
 78
78 -
 79
79 -
 80
80 -
81
-
82
-
83
-
84
-
85
-
86
-
87
-
88
-
89
-
90
-
91
-
92
-
93
-
94
-
95
-
96
-
97
-
98
-
99
-
100
-
101
-
102
-
103
-
104
-
105
-
106
-
107
-
108
-
109
-
110
-
111
-
112
-
113
-
114
-
115
-
116
-
117
-
118
-
119
-
120
-
121
-
122
-
123
-
124
-
125
-
126
-
127
-
128
-
129
-
130
-
131
-
132
-
133
-
134
-
135
-
136
-
137
-
138
-
139
-
140
-
141
-
142
-
143
-
144
-
145
-
146
-
147
-
148
-
149
-
150
-
151
-
152
-
153
-
154
-
155
-
156
-
157
-
158
-
159
-
160
-
161
-
162
-
163
-
164
-
165
-
166
-
167
-
168
-
169
-
170
-
171
-
172
-
173
-
174
-
175
-
176
-
177
-
178
-
179
-
180
-
181
-
182
-
183
-
184
-
185
-
186
-
187
-
188
-
189
-
190
-
191
-
192
-
193
-
194
-
195
-
196
-
197
-
198
-
199
-
200
-
201
-
202
-
203
-
204
-
205
-
206
-
207
-
208
-
209
-
210
-
211
-
212
-
213
-
214
-
215
-
216
-
217
-
218
-
219
-
220
-
221
-
222
-
223
-
224
-
225
-
226
-
227
-
228
 |
 |

6 Sector performance 6.2.6 - 6.2.6
70 Annual Report 2011
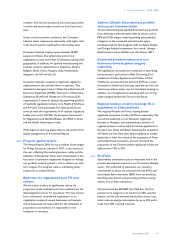
6.2.6 2011 financial performance
2011 proved to be a challenging year for driving sales
growth in Consumer Lifestyle. We began the year with
sales declines in the first two quarters, though we finished
the year with two quarters of positive growth and
improved stock levels. For the year, sales increased by
EUR 48 million, or 1% nominal growth. However, adjusted
for unfavorable currency and favorable portfolio changes,
comparable sales were unchanged from the previous year.
Key data
in millions of euros
2009 2010 2011
Sales 5,370 5,775 5,823
Sales growth
% increase (decrease), nominal (13) 8 1
% increase (decrease), comparable1) (12) 1 −
EBITA1) 454 718 472
as a % of sales 8.5 12.4 8.1
EBIT1) 436 679 392
as a % of sales 8.1 11.8 6.7
Net operating capital (NOC)1) 625 911 887
Cash flows before financing activities1) 574 493 (38)
Employees (FTEs) 13,625 14,095 18,291
1) For a reconciliation to the most directly comparable GAAP measures, see
chapter 15, Reconciliation of non-GAAP information, of this Annual Report
We achieved double-digit growth at Health & Wellness
and high single-digit growth at Personal Care, driven by
increased investment in advertising and promotion. Sales
at Domestic Appliances showed high single-digit growth,
led by strong growth in growth geographies, notably
China. Sales declined at Lifestyle Entertainment, where
growth was tempered by slow consumer spending in
mature geographies.
From a geographical perspective, we recorded 10%
comparable sales growth in growth geographies, which
was partly offset by a 6% decline in mature geographies,
mainly in Western Europe. Sales growth in growth
geographies was driven by solid growth in Latin America
and China, primarily in our Personal Care business.
Growth geographies’ share of sector sales increased from
38% in 2010 to 42% in 2011.
EBITA decreased from EUR 718 million, or 12.4% of sales,
in 2010 to EUR 472 million, or 8.1% of sales, in 2011.
Restructuring and acquisition-related charges amounted
to EUR 54 million in 2011, compared to EUR 31 million
in 2010. The year-on-year EBITA decrease was largely
attributable to lower gross margin and higher selling
expenses, particularly from increased investment in
advertising and promotion. EBITA was higher than in 2010
at Health & Wellness, but this was more than offset by
lower earnings at Lifestyle Entertainment and Licenses.
EBIT amounted to EUR 392 million, or 6.7% of sales,
which included EUR 80 million of amortization charges,
mainly related to intangible fixed assets at Lifestyle
Entertainment and Health & Wellness.
Net operating capital decreased from EUR 911 million in
2010 to EUR 887 million in 2011, primarily due to higher
provisions for the announced divestment of the
discontinued Television business, partially offset by higher
intangible fixed assets from acquisitions of Povos and
Preethi.
Cash flows before financing activities declined from an
inflow of EUR 493 million in 2010 to an outflow of EUR
38 million. The decline was attributable to lower cash
earnings and higher cash outflows for acquisitions.
Sales per geographic cluster
in millions of euros
■-Western Europe_■-North America_■-other mature_■-growth
8,000
4,000
0
2007
2,922
1,613
219
2,306
7,060
2008
2,446
1,289
225
2,226
6,186
20091)
2,203
1,077
198
1,892
5,370
2010
2,153
1,156
252
2,214
5,775
2011
2,040
1,065
276
2,442
5,823
1) Revised to reflect an adjusted geographic cluster allocation
Sales and net operating capital
in billions of euros ■-Sales----NOC
8
4
0
1.1
7.1
2007
0.8
6.2
2008
0.6
5.4
2009
0.9
5.8
2010
0.9
5.8
2011