BB&T 2011 Annual Report Download - page 103
Download and view the complete annual report
Please find page 103 of the 2011 BB&T annual report below. You can navigate through the pages in the report by either clicking on the pages listed below, or by using the keyword search tool below to find specific information within the annual report.-
 1
1 -
2
-
3
-
4
-
5
-
6
-
7
-
8
-
9
-
10
-
11
-
12
-
13
-
14
-
15
-
16
-
17
-
18
-
19
-
20
-
21
-
22
-
23
-
24
-
25
-
26
-
27
-
28
-
29
-
30
-
31
-
32
-
33
-
34
-
35
-
36
-
37
-
38
-
39
-
40
-
41
-
42
-
43
-
44
-
45
-
46
-
47
-
48
-
49
-
50
-
51
-
52
-
53
-
54
-
55
-
56
-
57
-
58
-
59
-
60
-
61
-
62
-
63
-
64
-
65
-
66
-
67
-
68
-
69
-
70
-
71
-
72
-
73
-
74
-
75
-
76
-
77
-
78
-
79
-
80
-
81
-
82
-
83
-
84
-
85
-
86
-
87
-
88
-
89
-
90
-
91
-
92
-
 93
93 -
 94
94 -
 95
95 -
 96
96 -
 97
97 -
 98
98 -
 99
99 -
 100
100 -
 101
101 -
 102
102 -
 103
103 -
 104
104 -
 105
105 -
 106
106 -
 107
107 -
 108
108 -
 109
109 -
 110
110 -
 111
111 -
 112
112 -
 113
113 -
114
-
115
-
116
-
117
-
118
-
119
-
120
-
121
-
122
-
123
-
124
-
125
-
126
-
127
-
128
-
129
-
130
-
131
-
132
-
133
-
134
-
135
-
136
-
137
-
138
-
139
-
140
-
141
-
142
-
143
-
144
-
145
-
146
-
147
-
148
-
149
-
150
-
151
-
152
-
153
-
154
-
155
-
156
-
157
-
158
-
159
-
160
-
161
-
162
-
163
 |
 |

At December 31, 2011 and 2010, securities with carrying values of approximately $15.5 billion and $19.3 billion,
respectively, were pledged to secure municipal deposits, securities sold under agreements to repurchase, other borrowings,
and for other purposes as required or permitted by law.
BB&T had certain investments in marketable debt securities and mortgage-backed securities issued by Fannie Mae and
Freddie Mac that exceeded ten percent of shareholders’ equity at December 31, 2011. The Fannie Mae investments had
total amortized cost and fair value of $10.3 billion at December 31, 2011, while Freddie Mac investments had total
amortized cost and fair values of $10.2 billion and $10.3 billion, respectively. These securities are carried at amortized
cost in the held to maturity portfolio or fair value in the available for sale portfolio.
At December 31, 2011 and 2010, non-agency mortgage-backed securities primarily consisted of residential mortgage-
backed securities.
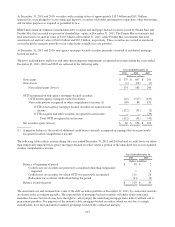
The gross realized gains and losses and other-than-temporary impairments recognized in income during the years ended
December 31, 2011, 2010 and 2009 are reflected in the following table:
Years Ended December 31,
2011 2010 2009
(Dollars in millions)
Gross gains $ 175 $ 607 $ 241
Gross losses (1) (22) (1)
Net realized gains (losses) 174 585 240
OTTI recognized on non-agency mortgage-backed securities:
OTTI on non-agency mortgage-backed securities (22) (117) (133)
Non-credit portion recognized in other comprehensive income (1) (90) 86 131
OTTI on non-agency mortgage-backed securities recognized in net
income (112) (31) (2)
OTTI on equity and other securities recognized in net income — — (39)
Total OTTI recognized in net income (112) (31) (41)
Net securities gains (losses) $ 62 $ 554 $ 199
(1) A negative balance is the result of additional credit losses currently recognized in earnings that were previously
recognized in other comprehensive income.
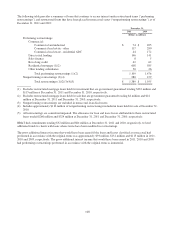
The following table reflects activity during the years ended December 31, 2011 and 2010 related to credit losses on other-
than-temporarily impaired non-agency mortgage-backed securities where a portion of the unrealized loss was recognized
in other comprehensive income:
Years Ended December 31,
2011 2010
(Dollars in millions)
Balance at beginning of period $ 30 $ 2
Credit losses on securities not previously considered other-than-temporarily
impaired 13
Credit losses on securities for which OTTI was previously recognized 111 28
Reductions for securities sold/settled during the period (13) (3)
Balance at end of period $ 129 $ 30
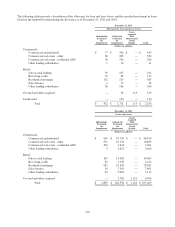
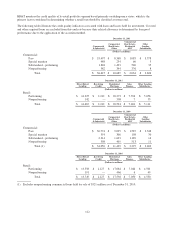
The amortized cost and estimated fair value of the debt securities portfolio at December 31, 2011, by contractual maturity,
are shown in the accompanying table. The expected life of mortgage-backed securities will differ from contractual
maturities because borrowers may have the right to call or prepay the underlying mortgage loans with or without call or
prepayment penalties. For purposes of the maturity table, mortgage-backed securities, which are not due at a single
maturity date, have been included in maturity groupings based on the contractual maturity.
103