BB&T 2011 Annual Report Download - page 40
Download and view the complete annual report
Please find page 40 of the 2011 BB&T annual report below. You can navigate through the pages in the report by either clicking on the pages listed below, or by using the keyword search tool below to find specific information within the annual report.-
 1
1 -
2
-
3
-
4
-
5
-
6
-
7
-
8
-
9
-
10
-
11
-
12
-
13
-
14
-
15
-
16
-
17
-
18
-
19
-
20
-
21
-
22
-
23
-
24
-
25
-
26
-
27
-
28
-
29
-
 30
30 -
 31
31 -
 32
32 -
 33
33 -
 34
34 -
 35
35 -
 36
36 -
 37
37 -
 38
38 -
 39
39 -
 40
40 -
 41
41 -
 42
42 -
 43
43 -
 44
44 -
 45
45 -
 46
46 -
 47
47 -
 48
48 -
 49
49 -
 50
50 -
51
-
52
-
53
-
54
-
55
-
56
-
57
-
58
-
59
-
60
-
61
-
62
-
63
-
64
-
65
-
66
-
67
-
68
-
69
-
70
-
71
-
72
-
73
-
74
-
75
-
76
-
77
-
78
-
79
-
80
-
81
-
82
-
83
-
84
-
85
-
86
-
87
-
88
-
89
-
90
-
91
-
92
-
93
-
94
-
95
-
96
-
97
-
98
-
99
-
100
-
101
-
102
-
103
-
104
-
105
-
106
-
107
-
108
-
109
-
110
-
111
-
112
-
113
-
114
-
115
-
116
-
117
-
118
-
119
-
120
-
121
-
122
-
123
-
124
-
125
-
126
-
127
-
128
-
129
-
130
-
131
-
132
-
133
-
134
-
135
-
136
-
137
-
138
-
139
-
140
-
141
-
142
-
143
-
144
-
145
-
146
-
147
-
148
-
149
-
150
-
151
-
152
-
153
-
154
-
155
-
156
-
157
-
158
-
159
-
160
-
161
-
162
-
163
 |
 |

Provision for Credit Losses
The provision for credit losses recorded by BB&T in 2011 was $1.2 billion, compared with $2.6 billion in 2010 and $2.8
billion in 2009. The provision for credit losses decreased 54.9% during 2011. Included in the provision for credit losses
during 2011 was $71 million related to covered loans. The provision for credit losses recorded for covered loans reflects
lower expected cash flows on certain loan pools compared to the original estimates. Approximately 80% of this provision
for credit losses is offset through a credit to noninterest income based on the provisions of the FDIC loss sharing
agreements. The decrease in the provision for credit losses during 2011 compared to 2010 was primarily due to improving
credit trends and outlook, as net charge-offs in 2011 decreased 34.3% compared to the prior year.
Net charge-offs were 1.57% of average loans and leases (or 1.59% excluding covered loans) for 2011 compared to 2.41%
of average loans and leases (or 2.59% excluding covered loans) during 2010. Net charge-offs for 2011 included $87
million related to the transfer and sale of residential mortgage loans in the second quarter. This compares to $605 million
of net charge-offs recorded in the prior year related to commercial and residential mortgage loans that were transferred to
the held for sale portfolio. Excluding these items, net charge-offs were 1.50% and 1.97% of average loans and leases for
2011 and 2010, respectively. The largest decreases in the provision for credit losses for 2011 were in the commercial and
residential mortgage portfolios. The decrease in the provision for credit losses during 2010 compared to 2009 was
primarily due to the improving economic outlook that began to materialize in the latter part of 2010.
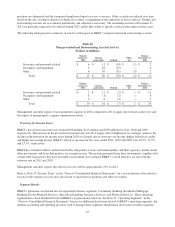
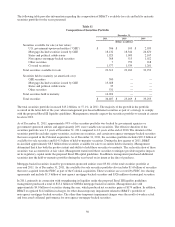
Noninterest Income
Noninterest income is a significant contributor to BB&T’s financial success. Noninterest income includes insurance
income, service charges on deposit accounts, mortgage banking income, investment banking and brokerage fees and
commissions, trust and investment advisory revenues, gains and losses on securities transactions, and commissions and
fees derived from other activities. Management continues to focus on diversifying its sources of revenue to further reduce
BB&T’s reliance on traditional spread-based interest income, as fee-based activities are a relatively stable revenue source
during periods of changing interest rates.
The following table provides a breakdown of BB&T’s noninterest income:
Table 8
Noninterest Income
Years Ended December 31,
% Change
2011
v.
2010
2010
v.
20092011 2010 2009
(Dollars in millions)
Insurance income $ 1,044 $ 1,041 $ 1,047 0.3 % (0.6)%
Service charges on deposits 563 618 690 (8.9) (10.4)
Mortgage banking income 436 521 658 (16.3) (20.8)
Investment banking and brokerage fees and commissions 333 352 346 (5.4) 1.7
Checkcard fees 271 274 227 (1.1) 20.7
Bankcard fees and merchant discounts 204 177 156 15.3 13.5
Trust and investment advisory revenues 173 159 139 8.8 14.4
Income from bank-owned life insurance 122 123 97 (0.8) 26.8
FDIC loss share income, net (289) (116) 14 149.1 NM
Securities gains (losses), net 62 554 199 (88.8) 178.4
Other income 194 254 361 (23.6) (29.6)
Total noninterest income $ 3,113 $ 3,957 $ 3,934 (21.3) 0.6
NM—not meaningful
40