BB&T 2011 Annual Report Download - page 63
Download and view the complete annual report
Please find page 63 of the 2011 BB&T annual report below. You can navigate through the pages in the report by either clicking on the pages listed below, or by using the keyword search tool below to find specific information within the annual report.-
 1
1 -
2
-
3
-
4
-
5
-
6
-
7
-
8
-
9
-
10
-
11
-
12
-
13
-
14
-
15
-
16
-
17
-
18
-
19
-
20
-
21
-
22
-
23
-
24
-
25
-
26
-
27
-
28
-
29
-
30
-
31
-
32
-
33
-
34
-
35
-
36
-
37
-
38
-
39
-
40
-
41
-
42
-
43
-
44
-
45
-
46
-
47
-
48
-
49
-
50
-
51
-
52
-
 53
53 -
 54
54 -
 55
55 -
 56
56 -
 57
57 -
 58
58 -
 59
59 -
 60
60 -
 61
61 -
 62
62 -
 63
63 -
 64
64 -
 65
65 -
 66
66 -
 67
67 -
 68
68 -
 69
69 -
 70
70 -
 71
71 -
 72
72 -
 73
73 -
74
-
75
-
76
-
77
-
78
-
79
-
80
-
81
-
82
-
83
-
84
-
85
-
86
-
87
-
88
-
89
-
90
-
91
-
92
-
93
-
94
-
95
-
96
-
97
-
98
-
99
-
100
-
101
-
102
-
103
-
104
-
105
-
106
-
107
-
108
-
109
-
110
-
111
-
112
-
113
-
114
-
115
-
116
-
117
-
118
-
119
-
120
-
121
-
122
-
123
-
124
-
125
-
126
-
127
-
128
-
129
-
130
-
131
-
132
-
133
-
134
-
135
-
136
-
137
-
138
-
139
-
140
-
141
-
142
-
143
-
144
-
145
-
146
-
147
-
148
-
149
-
150
-
151
-
152
-
153
-
154
-
155
-
156
-
157
-
158
-
159
-
160
-
161
-
162
-
163
 |
 |

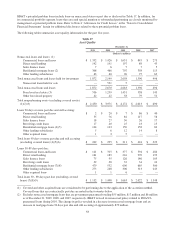
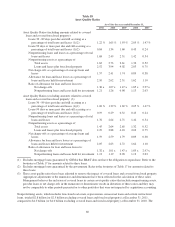
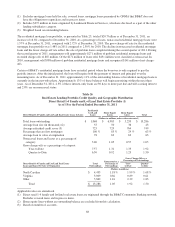
The following table provides further details regarding the payment status of TDRs outstanding at December 31, 2011:
Table 21
Troubled Debt Restructurings
December 31, 2011
Current Status
Past Due
30-89 Days (1)
Past Due
90 Days Or More (1) Total
(Dollars in millions)
Performing restructurings:
Commercial:
Commercial and industrial $ 73 98.6 % $ 1 1.4 % $ — —% $ 74
Commercial real estate - other 116 99.1 1 0.9 — — 117
Commercial real estate -
residential ADC 44 100.0 — — — — 44
Direct retail lending 136 93.1 8 5.5 2 1.4 146
Sales finance 4 50.0 1 12.5 3 37.5 8
Revolving credit 50 80.6 6 9.7 6 9.7 62
Residential mortgage (2) 488 80.3 92 15.1 28 4.6 608
Other lending subsidiaries 45 90.0 5 10.0 — — 50
Total performing
restructurings (2) 956 86.2 114 10.3 39 3.5 1,109
Nonperforming restructurings (3) 97 34.6 57 20.4 126 45.0 280
Total restructurings (2) $ 1,053 75.8 $ 171 12.3 $ 165 11.9 $ 1,389
(1) Past due performing restructurings are included in past due disclosures.
(2) Excludes restructured mortgage loans that are government guaranteed totaling $236 million.
(3) Nonperforming restructurings are included in nonaccrual loan disclosures.
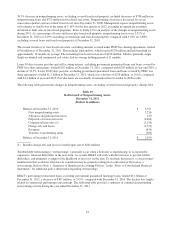
Allowance for Credit Losses
The allowance for credit losses, which totaled $2.3 billion and $2.8 billion at December 31, 2011 and 2010, respectively,
consists of the allowance for loan and lease losses, which is presented on the Consolidated Balance Sheets, and the reserve
for unfunded lending commitments, which is included in other liabilities on the Consolidated Balance Sheets. The
allowance for loan and lease losses amounted to 2.10% of loans and leases held for investment at December 31, 2011 (or
2.05% excluding covered loans), compared to 2.62% (or 2.63% excluding covered loans) at year-end 2010. The decline in
the allowance for loan and lease losses reflects continued improvement in the credit quality of the loan portfolio,
especially in the commercial portfolio segment due to improvement in risk-grade migration trends and reductions in
higher-risk commercial real estate loans. Impaired commercial loans continue to decline; however, the allowance for
commercial loans as a percentage of impaired commercial loans has increased from 11.2% at December 31, 2010 to
12.4% at December 31, 2011. The ratio of the allowance for loan and lease losses to nonperforming loans held for
investment, excluding covered loans, was 1.13x at December 31, 2011 compared to 1.19x at December 31, 2010.
BB&T’s net charge-offs totaled $1.7 billion for 2011 and amounted to 1.57% of average loans and leases (or 1.59%
excluding covered loans), compared to $2.5 billion, or 2.41% of average loans and leases (or 2.59% excluding covered
loans), in 2010. Included in net charge-offs for 2011 is $66 million of charge-offs related to covered loans. This represents
realized losses in certain acquired loan pools that exceed the amounts originally estimated at the acquisition date. This
impairment, which is subject to the loss sharing agreements, was provided for in prior quarters and therefore the
charge-off had no income statement impact. Net charge-offs for 2011 and 2010, included $87 million and $605 million of
losses on the sales of problem loans in connection with management’s nonperforming asset disposition strategy.
Excluding these items, the adjusted net charge-off ratio would have been 1.50% in 2011 and 1.97% in 2010. Net charge-
offs improved in all of the lending portfolios compared to the prior year, with the most significant reductions in the
commercial real estate portfolios. Management expects net charge-offs to approximate 1.30% in the first quarter of 2012
and trend lower throughout the remainder of the year.
63