BB&T 2011 Annual Report Download - page 36
Download and view the complete annual report
Please find page 36 of the 2011 BB&T annual report below. You can navigate through the pages in the report by either clicking on the pages listed below, or by using the keyword search tool below to find specific information within the annual report.-
 1
1 -
2
-
3
-
4
-
5
-
6
-
7
-
8
-
9
-
10
-
11
-
12
-
13
-
14
-
15
-
16
-
17
-
18
-
19
-
20
-
21
-
22
-
23
-
24
-
25
-
 26
26 -
 27
27 -
 28
28 -
 29
29 -
 30
30 -
 31
31 -
 32
32 -
 33
33 -
 34
34 -
 35
35 -
 36
36 -
 37
37 -
 38
38 -
 39
39 -
 40
40 -
 41
41 -
 42
42 -
 43
43 -
 44
44 -
 45
45 -
 46
46 -
47
-
48
-
49
-
50
-
51
-
52
-
53
-
54
-
55
-
56
-
57
-
58
-
59
-
60
-
61
-
62
-
63
-
64
-
65
-
66
-
67
-
68
-
69
-
70
-
71
-
72
-
73
-
74
-
75
-
76
-
77
-
78
-
79
-
80
-
81
-
82
-
83
-
84
-
85
-
86
-
87
-
88
-
89
-
90
-
91
-
92
-
93
-
94
-
95
-
96
-
97
-
98
-
99
-
100
-
101
-
102
-
103
-
104
-
105
-
106
-
107
-
108
-
109
-
110
-
111
-
112
-
113
-
114
-
115
-
116
-
117
-
118
-
119
-
120
-
121
-
122
-
123
-
124
-
125
-
126
-
127
-
128
-
129
-
130
-
131
-
132
-
133
-
134
-
135
-
136
-
137
-
138
-
139
-
140
-
141
-
142
-
143
-
144
-
145
-
146
-
147
-
148
-
149
-
150
-
151
-
152
-
153
-
154
-
155
-
156
-
157
-
158
-
159
-
160
-
161
-
162
-
163
 |
 |
Income Taxes
The calculation of BB&T’s income tax provision is complex and requires the use of estimates and judgments. As part of the
Company’s analysis and implementation of business strategies, consideration is given to the tax laws and regulations that apply
to the specific facts and circumstances for any tax position under evaluation. For tax positions that are uncertain in nature,
management determines whether the tax position is more likely than not to be sustained upon examination. For tax positions that
meet this threshold, management then estimates the amount of the tax benefit to recognize in the financial statements.
Management closely monitors tax developments in order to evaluate the effect they may have on the Company’s overall tax
position and the estimates and judgments used in determining the income tax provision and records adjustments as necessary.
Analysis of Results of Operations
Consolidated net income available to common shareholders totaled $1.3 billion for 2011, which generated basic earnings per
common share of $1.85 and diluted earnings per common share of $1.83. Net income available to common shareholders for
2010 and 2009 was $816 million and $729 million, respectively. Basic earnings per common share were $1.18 in 2010 and
$1.16 in 2009, while diluted earnings per common share were $1.16 and $1.15 for 2010 and 2009, respectively.
Two important and commonly used measures of bank profitability are return on average assets (net income as a
percentage of average total assets) and return on average common shareholders’ equity (net income available to common
shareholders as a percentage of average common shareholders’ equity). BB&T’s returns on average assets were 0.82%,
0.54%, and 0.56% for the years ended December 31, 2011, 2010 and 2009, respectively. The returns on average common
shareholders’ equity were 7.49%, 4.85%, and 4.93% for the last three years.
Net Interest Income and Net Interest Margin
Net interest income is BB&T’s primary source of revenue. Net interest income is influenced by a number of factors,
including the volume, mix and maturity of interest-earning assets and interest-bearing liabilities and the interest rates
earned and paid thereon. The difference between rates earned on interest-earning assets and the cost of the supporting
funds (with an adjustment made to tax-exempt items to provide comparability with taxable items, i.e., the “FTE”
adjustment) is measured by the net interest margin.
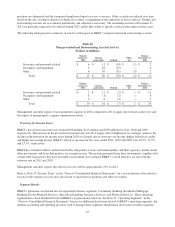
For 2011, net interest income on an FTE-adjusted basis totaled $5.7 billion, compared with $5.5 billion in 2010 and $5.0
billion in 2009. Net interest income on an FTE-adjusted basis increased 3.6% in 2011 compared to 2010. The increase in
net interest income was driven by lower funding costs, which declined $418 million compared to 2010. The improvement
in funding costs reflects a more favorable mix of funding liabilities, benefits from the accelerated amortization of
derivatives that were unwound in a gain position and decreases in rates paid on deposits. The improvement in funding
costs more than offset lower yields on new loans and securities. In addition, net interest income was higher due to better
performance from loans and securities acquired in the Colonial acquisition as cash flow expectations improved from the
prior estimates. Net interest income increased 9.9% in 2010 compared to 2009. The increase in net interest income during
2010 resulted primarily from higher interest from the covered loan and securities portfolios, which were outstanding for
the full year of 2010 compared to a partial year for 2009. In addition, the covered loan portfolio’s yield increased during
2010 as a result of improved expectations of cash flows from the original estimates. Net interest income for 2010 also
benefited from lower funding costs, as management grew noninterest-bearing deposits and was able to reduce higher cost
certificates and other interest-bearing liabilities.
The FTE-adjusted net interest margin is the primary measure used in evaluating the gross profit margin from the
portfolios of earning assets. The FTE-adjusted net interest margin was 4.06% in 2011, 4.03% in 2010 and 3.66% in 2009.
The improvement in the net interest margin in 2011 compared to 2010 primarily reflects the higher yields on covered
loans and securities and lower funding costs. During 2010, the average yield on interest earning assets increased 19 basis
points compared to the average yield during 2009, while the average cost of funds over the same time period decreased 21
basis points. The improvement in the net interest margin during 2010 was primarily due to the higher yield assets acquired
in the Colonial acquisition and lower funding costs.
Management expects the net interest margin to be in the 3.85% to 3.95% range in the first quarter of 2012 due to runoff of
the covered loan portfolio, lower investment yields, and an overall lower interest rate environment. Deposit costs are
expected to continue to trend lower in 2012, which will benefit net interest income. The runoff of the covered loans will
also result in a lower offset to noninterest income from the FDIC loss share asset. Despite the lower net interest margin,
management expects net interest income to grow in 2012 due to an increase in earning assets.
36