BB&T 2011 Annual Report Download - page 37
Download and view the complete annual report
Please find page 37 of the 2011 BB&T annual report below. You can navigate through the pages in the report by either clicking on the pages listed below, or by using the keyword search tool below to find specific information within the annual report.-
 1
1 -
2
-
3
-
4
-
5
-
6
-
7
-
8
-
9
-
10
-
11
-
12
-
13
-
14
-
15
-
16
-
17
-
18
-
19
-
20
-
21
-
22
-
23
-
24
-
25
-
26
-
 27
27 -
 28
28 -
 29
29 -
 30
30 -
 31
31 -
 32
32 -
 33
33 -
 34
34 -
 35
35 -
 36
36 -
 37
37 -
 38
38 -
 39
39 -
 40
40 -
 41
41 -
 42
42 -
 43
43 -
 44
44 -
 45
45 -
 46
46 -
 47
47 -
48
-
49
-
50
-
51
-
52
-
53
-
54
-
55
-
56
-
57
-
58
-
59
-
60
-
61
-
62
-
63
-
64
-
65
-
66
-
67
-
68
-
69
-
70
-
71
-
72
-
73
-
74
-
75
-
76
-
77
-
78
-
79
-
80
-
81
-
82
-
83
-
84
-
85
-
86
-
87
-
88
-
89
-
90
-
91
-
92
-
93
-
94
-
95
-
96
-
97
-
98
-
99
-
100
-
101
-
102
-
103
-
104
-
105
-
106
-
107
-
108
-
109
-
110
-
111
-
112
-
113
-
114
-
115
-
116
-
117
-
118
-
119
-
120
-
121
-
122
-
123
-
124
-
125
-
126
-
127
-
128
-
129
-
130
-
131
-
132
-
133
-
134
-
135
-
136
-
137
-
138
-
139
-
140
-
141
-
142
-
143
-
144
-
145
-
146
-
147
-
148
-
149
-
150
-
151
-
152
-
153
-
154
-
155
-
156
-
157
-
158
-
159
-
160
-
161
-
162
-
163
 |
 |

The FTE yield on the total securities portfolio was 2.67% for the year ended December 31, 2011 compared to 3.89% for
the prior year. The decrease in the annualized FTE yield on the average securities portfolio was primarily the result of
management’s efforts to deleverage and de-risk the portfolio during 2010. The securities purchased included floating rate
and other securities with lower yields. The yield on the securities portfolio benefited from higher yields on covered
securities due to the impact of duration adjustments in the prior year.
The average annualized FTE yield for 2011 for the total loan portfolio was 5.87% compared to 5.88% for the prior year.
The slight decrease in the FTE yield on the loan portfolio was primarily due to new loan volumes originated at lower
rates, partially offset by the acquired loans from the Colonial transaction, which have produced higher yields due to better
than expected performance.
The average rate paid on interest-bearing deposits dropped to 0.68% during 2011, from 1.05% in 2010. The average cost
for interest-bearing deposits declined during 2011 as a result of the decrease in relatively higher-rate CDs and
management’s ability to lower rates on other deposit products.
The rates paid on average short-term borrowings declined from 0.28% in 2010 to 0.27% during 2011. At December 31, 2011,
the targeted Federal funds rate was a range of zero percent to 0.25%. The average rate on long-term debt during 2011 was
3.40%, a decrease of 56 basis points compared to the prior year. This reduction was due to new issuances at lower rates and
the positive impact of accelerated amortization from certain derivatives that were unwound in a gain position.
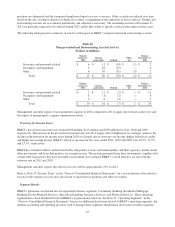
The following table provides information related to covered and acquired loans, covered securities and the FDIC loss
sharing asset recognized in the Colonial acquisition.
Table 6
Revenue, Net of Provision Impact from Acquired Assets (1)
Years Ended December 31,
2011 2010 2009
(Dollars in millions)
Interest income-loans $ 1,070 $ 947 $ 238
Interest income-securities 168 142 50
Total interest income 1,238 1,089 288
Provision for covered loans (71) (144) —
FDIC loss share income, net (289) (116) 14
Net revenue after provision for covered loans $ 878 $ 829 $ 302
FDIC loss share income, net:
Offset to provision for covered loans $ 57 $ 115 $ —
Accretion due to credit loss improvement (297) (203) 23
Accretion for securities (49) (28) (9)
Total $ (289) $ (116) $ 14
(1) Presents amounts related to covered and acquired loans, covered securities and the FDIC loss sharing asset recognized in
the Colonial acquisition. Excludes all amounts related to other assets acquired and liabilities assumed in the acquisition.
Interest income for 2011 on loans and securities acquired in the Colonial acquisition increased $149 million compared to
2010, which was offset by a decrease in FDIC loss share income. The majority of the increase is related to loans and
reflects higher expected cash flows based on the quarterly cash flow reassessment process. The yield on covered and other
acquired loans for 2011 was 19.28% compared to 13.26% in 2010. At December 31, 2011, the accretable yield balance on
these loans was $1.8 billion. Accretable yield represents the excess of future cash flows above the current net carrying
amount of loans and will be recognized into income over the remaining life of the covered and acquired loans. The
increase in interest income on securities compared to the corresponding periods of the prior year was primarily a result of
security duration adjustments in the prior year, which is offset in FDIC loss share income.
During 2011 and 2010, BB&T reclassified $334 million and $793 million, respectively, from the nonaccretable balance to
accretable yield for purchased nonimpaired loans. During 2011 and 2010, BB&T reclassified $45 million and $405 million,
respectively, from the nonaccretable balance to accretable yield for purchased impaired loans. These reclassifications were
37