BB&T 2011 Annual Report Download - page 90
Download and view the complete annual report
Please find page 90 of the 2011 BB&T annual report below. You can navigate through the pages in the report by either clicking on the pages listed below, or by using the keyword search tool below to find specific information within the annual report.-
 1
1 -
2
-
3
-
4
-
5
-
6
-
7
-
8
-
9
-
10
-
11
-
12
-
13
-
14
-
15
-
16
-
17
-
18
-
19
-
20
-
21
-
22
-
23
-
24
-
25
-
26
-
27
-
28
-
29
-
30
-
31
-
32
-
33
-
34
-
35
-
36
-
37
-
38
-
39
-
40
-
41
-
42
-
43
-
44
-
45
-
46
-
47
-
48
-
49
-
50
-
51
-
52
-
53
-
54
-
55
-
56
-
57
-
58
-
59
-
60
-
61
-
62
-
63
-
64
-
65
-
66
-
67
-
68
-
69
-
70
-
71
-
72
-
73
-
74
-
75
-
76
-
77
-
78
-
79
-
 80
80 -
 81
81 -
 82
82 -
 83
83 -
 84
84 -
 85
85 -
 86
86 -
 87
87 -
 88
88 -
 89
89 -
 90
90 -
 91
91 -
 92
92 -
 93
93 -
 94
94 -
 95
95 -
 96
96 -
 97
97 -
 98
98 -
 99
99 -
 100
100 -
101
-
102
-
103
-
104
-
105
-
106
-
107
-
108
-
109
-
110
-
111
-
112
-
113
-
114
-
115
-
116
-
117
-
118
-
119
-
120
-
121
-
122
-
123
-
124
-
125
-
126
-
127
-
128
-
129
-
130
-
131
-
132
-
133
-
134
-
135
-
136
-
137
-
138
-
139
-
140
-
141
-
142
-
143
-
144
-
145
-
146
-
147
-
148
-
149
-
150
-
151
-
152
-
153
-
154
-
155
-
156
-
157
-
158
-
159
-
160
-
161
-
162
-
163
 |
 |

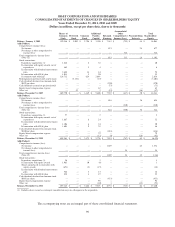
BB&T CORPORATION AND SUBSIDIARIES
CONSOLIDATED STATEMENTS OF CHANGES IN SHAREHOLDERS’ EQUITY
Years Ended December 31, 2011, 2010 and 2009
(Dollars in millions, except per share data, shares in thousands)
Shares of
Common
Stock
Preferred
Stock
Common
Stock
Additional
Paid-In
Capital
Retained
Earnings
Accumulated
Other
Comprehensive
Income (Loss)
Noncontrolling
Interests
Total
Shareholders’
Equity
Balance, January 1, 2009 559,248 $ 3,082 $ 2,796 $ 3,510 $ 7,381 $ (732) $ 44 $ 16,081
Add (Deduct):
Comprehensive income (loss):
Net income — — — — 853 — 24 877
Net change in other comprehensive
income (loss) — — — — — 315 — 315
Total comprehensive income (loss)
(Note 12) — — — — 853 315 24 1,192
Stock transactions:
In purchase acquisitions (1) 1,628 — 8 32 — — — 40
In connection with equity awards, net of
repurchases 463 — 2 4 — — — 6
In connection with dividend reinvestment
plan 2,688 — 14 44 — — — 58
In connection with 401(k) plan 1,011 — 5 20 — — — 25
In common stock offerings 124,712 — 624 2,014 — — — 2,638
Redemption of preferred stock and warrant — (3,134) — (67) — — — (3,201)
Cash dividends declared on common stock,
$0.92 per share — — — — (570) — — (570)
Cash dividends accrued on preferred stock — — — — (73) — — (73)
Equity-based compensation expense — — — 62 — — — 62
Other, net — 52 — 1 (52) — (18) (17)
Balance, December 31, 2009 689,750 $ — $ 3,449 $ 5,620 $ 7,539 $ (417) $ 50 $ 16,241
Add (Deduct):
Comprehensive income (loss):
Net income — — — — 816 — 38 854
Net change in other comprehensive
income (loss) — — — — — (330) — (330)
Total comprehensive income (loss)
(Note 12) — — — — 816 (330) 38 524
Stock transactions:
In purchase acquisitions (1) 57 — — 2 — — — 2
In connection with equity awards, net of
repurchases 1,667 — 8 24 — — — 32
In connection with dividend reinvestment
plan 1,106 — 6 24 — — — 30
In connection with 401(k) plan 1,801 — 9 39 — — — 48
Cash dividends declared on common stock,
$0.60 per share — — — — (416) — — (416)
Equity-based compensation expense — — — 79 — — — 79
Other, net — — — (12) (4) — (26) (42)
Balance, December 31, 2010 694,381 $ — $ 3,472 $ 5,776 $ 7,935 $ (747) $ 62 $ 16,498
Add (Deduct):
Comprehensive income (loss):
Net income — — — — 1,289 — 43 1,332
Net change in other comprehensive
income (loss) — — — — — 34 — 34
Total comprehensive income (loss)
(Note 12) — — — — 1,289 34 43 1,366
Stock transactions:
In purchase acquisitions (1) 26 — — 1 — — — 1
In connection with equity awards 1,963 — 10 (9) — — — 1
Shares repurchased in connection with
equity awards (651) — (3) (15) — — — (18)
In connection with dividend reinvestment
plan 586 — 3 13 — — — 16
In connection with 401(k) plan 838 — 4 19 — — — 23
Cash dividends declared on common stock,
$0.65 per share — — — — (453) — — (453)
Equity-based compensation expense — — — 98 — — — 98
Other, net — — — (10) 1 — (43) (52)
Balance, December 31, 2011 697,143 $ — $ 3,486 $ 5,873 $ 8,772 $ (713) $ 62 $ 17,480
(1) Includes shares issued as contingent consideration in years subsequent to the acquisition.
The accompanying notes are an integral part of these consolidated financial statements.
90