BB&T 2011 Annual Report Download - page 55
Download and view the complete annual report
Please find page 55 of the 2011 BB&T annual report below. You can navigate through the pages in the report by either clicking on the pages listed below, or by using the keyword search tool below to find specific information within the annual report.-
 1
1 -
2
-
3
-
4
-
5
-
6
-
7
-
8
-
9
-
10
-
11
-
12
-
13
-
14
-
15
-
16
-
17
-
18
-
19
-
20
-
21
-
22
-
23
-
24
-
25
-
26
-
27
-
28
-
29
-
30
-
31
-
32
-
33
-
34
-
35
-
36
-
37
-
38
-
39
-
40
-
41
-
42
-
43
-
44
-
 45
45 -
 46
46 -
 47
47 -
 48
48 -
 49
49 -
 50
50 -
 51
51 -
 52
52 -
 53
53 -
 54
54 -
 55
55 -
 56
56 -
 57
57 -
 58
58 -
 59
59 -
 60
60 -
 61
61 -
 62
62 -
 63
63 -
 64
64 -
 65
65 -
66
-
67
-
68
-
69
-
70
-
71
-
72
-
73
-
74
-
75
-
76
-
77
-
78
-
79
-
80
-
81
-
82
-
83
-
84
-
85
-
86
-
87
-
88
-
89
-
90
-
91
-
92
-
93
-
94
-
95
-
96
-
97
-
98
-
99
-
100
-
101
-
102
-
103
-
104
-
105
-
106
-
107
-
108
-
109
-
110
-
111
-
112
-
113
-
114
-
115
-
116
-
117
-
118
-
119
-
120
-
121
-
122
-
123
-
124
-
125
-
126
-
127
-
128
-
129
-
130
-
131
-
132
-
133
-
134
-
135
-
136
-
137
-
138
-
139
-
140
-
141
-
142
-
143
-
144
-
145
-
146
-
147
-
148
-
149
-
150
-
151
-
152
-
153
-
154
-
155
-
156
-
157
-
158
-
159
-
160
-
161
-
162
-
163
 |
 |

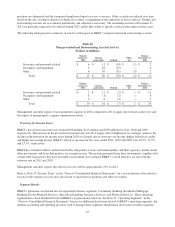
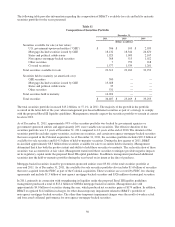
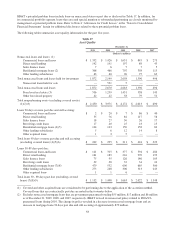
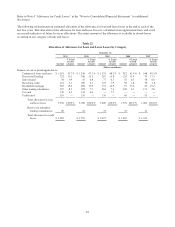
The following table presents BB&T’s total loan portfolio based upon BB&T’s lines of business, as discussed herein,
rather than upon regulatory reporting classifications:
Table 15
Composition of Loan and Lease Portfolio Based on Lines of Business
December 31,
2011 2010 2009 2008 2007
(Dollars in millions)
Commercial loans and leases $ 49,165 $ 48,886 $ 49,820 $ 50,480 $ 44,870
Direct retail lending 14,467 13,749 14,283 15,454 15,691
Sales finance 7,401 7,050 6,290 6,354 6,021
Revolving credit 2,212 2,127 2,016 1,777 1,618
Residential mortgage 20,581 17,550 15,435 17,091 17,467
Other lending subsidiaries 8,737 7,953 7,670 6,089 5,240
Other acquired 39 58 123 — —
Total loans and leases held for investment
(excluding covered loans) 102,602 97,373 95,637 97,245 90,907
Covered 4,867 6,194 8,019 — —
Total loans and leases held for investment 107,469 103,567 103,656 97,245 90,907
Loans held for sale 3,736 3,697 2,551 1,424 779
Total loans and leases $ 111,205 $ 107,264 $ 106,207 $ 98,669 $ 91,686
Growth in the lending portfolio accelerated during the second half of 2011, as demand increased and runoff of higher-risk
commercial real estate portfolios became less of a headwind. Total loans were $111.2 billion at year-end 2011, up $3.9
billion, or 3.7%, compared to the balance at December 31, 2010. Covered loans acquired in the Colonial acquisition
decreased $1.3 billion, or 21.4%, during 2011. Average total loans were $106.0 billion for 2011, up $1.2 billion compared
to the prior year. Management expects average total loans to grow in the 5-7% range for the first quarter of 2012 on an
annualized basis compared to the fourth quarter of 2011, contingent upon the economy.
55