BB&T 2011 Annual Report Download - page 42
Download and view the complete annual report
Please find page 42 of the 2011 BB&T annual report below. You can navigate through the pages in the report by either clicking on the pages listed below, or by using the keyword search tool below to find specific information within the annual report.-
 1
1 -
2
-
3
-
4
-
5
-
6
-
7
-
8
-
9
-
10
-
11
-
12
-
13
-
14
-
15
-
16
-
17
-
18
-
19
-
20
-
21
-
22
-
23
-
24
-
25
-
26
-
27
-
28
-
29
-
30
-
31
-
 32
32 -
 33
33 -
 34
34 -
 35
35 -
 36
36 -
 37
37 -
 38
38 -
 39
39 -
 40
40 -
 41
41 -
 42
42 -
 43
43 -
 44
44 -
 45
45 -
 46
46 -
 47
47 -
 48
48 -
 49
49 -
 50
50 -
 51
51 -
 52
52 -
53
-
54
-
55
-
56
-
57
-
58
-
59
-
60
-
61
-
62
-
63
-
64
-
65
-
66
-
67
-
68
-
69
-
70
-
71
-
72
-
73
-
74
-
75
-
76
-
77
-
78
-
79
-
80
-
81
-
82
-
83
-
84
-
85
-
86
-
87
-
88
-
89
-
90
-
91
-
92
-
93
-
94
-
95
-
96
-
97
-
98
-
99
-
100
-
101
-
102
-
103
-
104
-
105
-
106
-
107
-
108
-
109
-
110
-
111
-
112
-
113
-
114
-
115
-
116
-
117
-
118
-
119
-
120
-
121
-
122
-
123
-
124
-
125
-
126
-
127
-
128
-
129
-
130
-
131
-
132
-
133
-
134
-
135
-
136
-
137
-
138
-
139
-
140
-
141
-
142
-
143
-
144
-
145
-
146
-
147
-
148
-
149
-
150
-
151
-
152
-
153
-
154
-
155
-
156
-
157
-
158
-
159
-
160
-
161
-
162
-
163
 |
 |
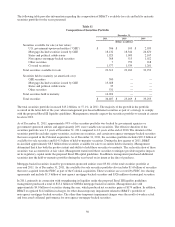
Checkcard fees decreased slightly in 2011 compared to 2010, due to the Durbin Amendment to the Dodd-Frank Act,
which was implemented on October 1, 2011. The decrease resulting from the implementation was more than offset by
higher volumes during the year. The Durbin amendment limited the rate banks could assess for debit card transactions. In
2010, checkcard fees were up $47 million, or 20.7%, on higher volumes.
Bankcard fees and merchant discounts increased $27 million in 2011 and $21 million in 2010 compared to 2009. The
increased bankcard fees were the result of higher volumes for both retail and commercial bankcard activities.
Trust and investment advisory revenues are based on the types of services provided as well as the overall value of the
assets managed, which is affected by stock market conditions. In 2011, trust and investment advisory revenues increased
$14 million, or 8.8%, due to improved market conditions. During 2010, trust and investment advisory revenues increased
by $20 million, or 14.4%, compared to 2009, primarily due to fee increases and improved market conditions.
Income from bank-owned life insurance was $122 million for 2011 compared to $123 million in 2010 and $97 million in
2009. The increase in 2010 compared to 2009 was primarily due to new purchases and excess death proceeds.
FDIC loss share income reflects the offset to the provision for covered loans, accretion of the FDIC receivable due to
credit loss improvement and accretion related to covered securities. During 2011 and 2010, covered loans experienced
better performance than originally anticipated resulting in additional interest income. A significant portion of the increases
in interest income for 2011 and 2010 was offset by reductions in noninterest income. For 2011 and 2010, noninterest
income was reduced by $297 million and $203 million, respectively, related to improvement in loan performance. These
decreases in income were partially offset by increases of $57 million and $115 million, respectively, which reflected
approximately 80% of the provision for credit losses recorded on covered loans for 2011 and 2010.
BB&T recognized $62 million in net securities gains during 2011. The net securities gains during 2011 included $174
million of net gains realized from securities sales and $112 million of other-than-temporary impairments. The
other-than-temporary impairment charges recognized during 2011 are due to weaker actual and forecasted collateral
performance for non-agency mortgage-backed securities. BB&T recognized $554 million in net securities gains during
2010. The net securities gains recognized in 2010 included $585 million of net gains realized from securities sales and $31
million of losses as a result of other-than-temporary impairments. The large increase in securities gains during 2010
reflects the results of the balance sheet deleveraging strategy that was executed during the second quarter of 2010 and the
de-risking of the investment portfolio that began during the third quarter of 2010 and was completed in the fourth quarter.
Refer to the “Analysis of Financial Condition – Investment Activities” section for a detailed discussion of strategies
executed during the years presented.
Other income decreased $60 million in 2011 compared to 2010, primarily due to losses and write-downs on commercial
loans that were transferred to the loans held for sale portfolio in 2010 in connection with management’s nonperforming
loan disposition strategy. There was a total of $149 million of losses and write-downs recorded in 2011 compared to $90
million in 2010. Other income decreased $107 million in 2010 compared to 2009, primarily due to losses and write-downs
on commercial loans that were transferred to the loans held for sale portfolio in connection with management’s
nonperforming loan disposition strategy.
Noninterest revenue sources have been negatively impacted by many regulatory initiatives over the past several years,
including changes to Regulation E, posting order of client transactions and limits on interchange revenue. Management
now estimates that this has negatively impacted revenues by approximately $360 million on an annual run rate basis
beginning in 2012. To date, management has implemented or identified changes in products and fees to offset slightly
over half of the potential lost revenue and is continuing to evaluate the Company’s product offerings in an effort to
eliminate, to the extent possible, the negative financial impacts of these regulatory changes. Management currently
expects noninterest income to increase during 2012 compared to 2011.
Noninterest Expense
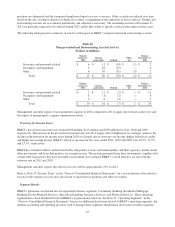
Noninterest expense totaled $5.8 billion in 2011, $5.7 billion in 2010 and $4.9 billion in 2009. Noninterest expense
includes certain merger-related and restructuring charges recorded during the years 2011, 2010 and 2009 as noted in the
Table 10 below. These amounts totaled $16 million in 2011, $69 million in 2010, and $38 million in 2009. Additional
disclosures related to these merger-related and restructuring charges are presented in “Merger-Related and Restructuring
42