BB&T 2011 Annual Report Download - page 60
Download and view the complete annual report
Please find page 60 of the 2011 BB&T annual report below. You can navigate through the pages in the report by either clicking on the pages listed below, or by using the keyword search tool below to find specific information within the annual report.-
 1
1 -
2
-
3
-
4
-
5
-
6
-
7
-
8
-
9
-
10
-
11
-
12
-
13
-
14
-
15
-
16
-
17
-
18
-
19
-
20
-
21
-
22
-
23
-
24
-
25
-
26
-
27
-
28
-
29
-
30
-
31
-
32
-
33
-
34
-
35
-
36
-
37
-
38
-
39
-
40
-
41
-
42
-
43
-
44
-
45
-
46
-
47
-
48
-
49
-
 50
50 -
 51
51 -
 52
52 -
 53
53 -
 54
54 -
 55
55 -
 56
56 -
 57
57 -
 58
58 -
 59
59 -
 60
60 -
 61
61 -
 62
62 -
 63
63 -
 64
64 -
 65
65 -
 66
66 -
 67
67 -
 68
68 -
 69
69 -
 70
70 -
71
-
72
-
73
-
74
-
75
-
76
-
77
-
78
-
79
-
80
-
81
-
82
-
83
-
84
-
85
-
86
-
87
-
88
-
89
-
90
-
91
-
92
-
93
-
94
-
95
-
96
-
97
-
98
-
99
-
100
-
101
-
102
-
103
-
104
-
105
-
106
-
107
-
108
-
109
-
110
-
111
-
112
-
113
-
114
-
115
-
116
-
117
-
118
-
119
-
120
-
121
-
122
-
123
-
124
-
125
-
126
-
127
-
128
-
129
-
130
-
131
-
132
-
133
-
134
-
135
-
136
-
137
-
138
-
139
-
140
-
141
-
142
-
143
-
144
-
145
-
146
-
147
-
148
-
149
-
150
-
151
-
152
-
153
-
154
-
155
-
156
-
157
-
158
-
159
-
160
-
161
-
162
-
163
 |
 |

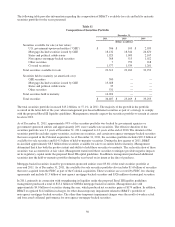
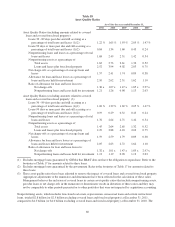
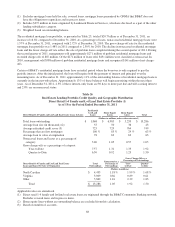
Table 18
Asset Quality Ratios
As of / for the years ended December 31,
2011 2010 2009 2008 2007
Asset Quality Ratios (including amounts related to covered
loans and covered foreclosed property):
Loans 30 - 89 days past due and still accruing as a
percentage of total loans and leases (1)(2) 1.22 % 1.65 % 1.93 % 2.05 % 1.47 %
Loans 90 days or more past due and still accruing as a
percentage of total loans and leases (1)(2) 0.84 1.34 1.60 0.43 0.24
Nonperforming loans and leases as a percentage of total
loans and leases 1.68 2.49 2.51 1.42 0.54
Nonperforming assets as a percentage of:
Total assets 1.62 2.73 2.61 1.32 0.52
Loans and leases plus foreclosed property 2.52 3.94 4.02 2.03 0.75
Net charge-offs as a percentage of average loans and
leases 1.57 2.41 1.74 0.89 0.38
Allowance for loan and lease losses as a percentage of
loans and leases held for investment 2.10 2.62 2.51 1.62 1.10
Ratio of allowance for loan and lease losses to:
Net charge-offs 1.36 x 1.07 x 1.47 x 1.85 x 2.97 x
Nonperforming loans and leases held for investment 1.21 1.26 0.98 1.13 2.03
Asset Quality Ratios (excluding amounts related to covered
loans and covered foreclosed property: (3)
Loans 30 - 89 days past due and still accruing as a
percentage of total loans and leases (1)(2) 1.06 % 1.39 % 1.69 % 2.05 % 1.47 %
Loans 90 days or more past due and still accruing as a
percentage of total loans and leases (1)(2) 0.19 0.29 0.32 0.43 0.24
Nonperforming loans and leases as a percentage of total
loans and leases 1.76 2.64 2.71 1.42 0.54
Nonperforming assets as a percentage of:
Total assets 1.45 2.64 2.65 1.32 0.52
Loans and leases plus foreclosed property 2.29 3.88 4.18 2.03 0.75
Net charge-offs as a percentage of average loans and
leases 1.59 2.59 1.79 0.89 0.38
Allowance for loan and lease losses as a percentage of
loans and leases held for investment 2.05 2.63 2.72 1.62 1.10
Ratio of allowance for loan and lease losses to:
Net charge-offs 1.32 x 1.01 x 1.47 x 1.85 x 2.97 x
Nonperforming loans and leases held for investment 1.13 1.19 0.98 1.13 2.03
(1) Excludes mortgage loans guaranteed by GNMA that BB&T does not have the obligation to repurchase. Refer to the
footnotes of Table 17 for amounts related to these loans.
(2) Excludes mortgage loans guaranteed by the government. Refer to the footnotes of Table 17 for amounts related to
these loans.
(3) These asset quality ratios have been adjusted to remove the impact of covered loans and covered foreclosed property.
Appropriate adjustments to the numerator and denominator have been reflected in the calculation of these ratios.
Management believes the inclusion of covered loans in certain asset quality ratios that include nonperforming assets,
past due loans or net charge-offs in the numerator or denominator results in distortion of these ratios and they may
not be comparable to other periods presented or to other portfolios that were not impacted by acquisition accounting.
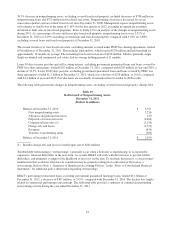
Nonperforming assets, which includes foreclosed real estate, repossessions, nonaccrual loans and certain restructured
loans, totaled $2.8 billion (or $2.5 billion excluding covered loans and foreclosed property) at December 31, 2011,
compared to $4.3 billion (or $4.0 billion excluding covered loans and foreclosed property) at December 31, 2010. The
60