BB&T 2011 Annual Report Download - page 46
Download and view the complete annual report
Please find page 46 of the 2011 BB&T annual report below. You can navigate through the pages in the report by either clicking on the pages listed below, or by using the keyword search tool below to find specific information within the annual report.-
 1
1 -
2
-
3
-
4
-
5
-
6
-
7
-
8
-
9
-
10
-
11
-
12
-
13
-
14
-
15
-
16
-
17
-
18
-
19
-
20
-
21
-
22
-
23
-
24
-
25
-
26
-
27
-
28
-
29
-
30
-
31
-
32
-
33
-
34
-
35
-
 36
36 -
 37
37 -
 38
38 -
 39
39 -
 40
40 -
 41
41 -
 42
42 -
 43
43 -
 44
44 -
 45
45 -
 46
46 -
 47
47 -
 48
48 -
 49
49 -
 50
50 -
 51
51 -
 52
52 -
 53
53 -
 54
54 -
 55
55 -
 56
56 -
57
-
58
-
59
-
60
-
61
-
62
-
63
-
64
-
65
-
66
-
67
-
68
-
69
-
70
-
71
-
72
-
73
-
74
-
75
-
76
-
77
-
78
-
79
-
80
-
81
-
82
-
83
-
84
-
85
-
86
-
87
-
88
-
89
-
90
-
91
-
92
-
93
-
94
-
95
-
96
-
97
-
98
-
99
-
100
-
101
-
102
-
103
-
104
-
105
-
106
-
107
-
108
-
109
-
110
-
111
-
112
-
113
-
114
-
115
-
116
-
117
-
118
-
119
-
120
-
121
-
122
-
123
-
124
-
125
-
126
-
127
-
128
-
129
-
130
-
131
-
132
-
133
-
134
-
135
-
136
-
137
-
138
-
139
-
140
-
141
-
142
-
143
-
144
-
145
-
146
-
147
-
148
-
149
-
150
-
151
-
152
-
153
-
154
-
155
-
156
-
157
-
158
-
159
-
160
-
161
-
162
-
163
 |
 |
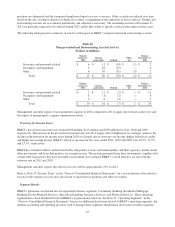
Fluctuations in noninterest income and noninterest expense incurred directly by the segments are more fully discussed in
the “Noninterest Income” and “Noninterest Expense” sections above.
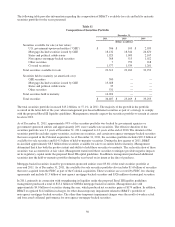
Community Banking
Community Banking has a network of 1,779 banking offices at the end of 2011, a decrease of 3 offices compared to 1,782
banking offices at December 31, 2010. The decrease in offices is the result of closing low volume branches partially offset
by de novo branch openings.
Net income attributable to Community Banking increased $457 million to $533 million in 2011. The increase in net
income compared to 2010 was primarily due to a lower allocated provision for loan and lease losses. Comparing 2010 to
2009, net income in the Community Banking segment decreased $222 million, or 74.5%, to $76 million primarily due to
higher foreclosed property expense.
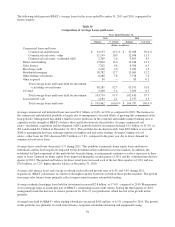
Net interest income for Community Banking totaled $3.6 billion in 2011 compared to $3.8 billion in 2010. The decline in
net interest income was primarily the effect of a lower interest rate environment. The decline in net interest income
attributable to low interest rates was partially offset by improvements in the deposit mix, as the result of an increase in
noninterest checking balances and a decrease in client certificates of deposits. Net interest income earned in 2010 rose by
$234 million, or 6.6%, compared to 2009. The increase in the net interest income in 2010 was primarily due to
improvements in the deposit mix.
The allocated provision for loan and lease losses declined $1.2 billion, or 66.2%, to $608 million in 2011, reflecting lower
charge-offs in the commercial real estate and residential ADC loan portfolios. The allocated provision for loan and lease
losses declined $54 million, or 2.9%, from 2009 to 2010 due to lower loan balances.
Noninterest income in Community Banking decreased $181 million, or 15.1%, to $1.0 billion in 2011, primarily due to
higher losses on commercial loans held for sale, lower overdraft fees, and lower checkcard fees. This decline in
noninterest income was offset by increases in merchant discounts, deposit account service charges, account analysis fees,
and credit card interchange fees. In 2010, noninterest income declined $26 million, or 2.1%, driven primarily by lower
overdraft fees, as well as higher losses on commercial nonperforming loans held for sale. Noninterest income allocated
from other segments, which is reported as intersegment net referral fees (“referral fees”), declined by $12 million, or 8.2%
in 2011, primarily due to lower referrals for residential mortgage lending as originations slowed. Noninterest income
allocated from other segments of $146 million in 2010 was $40 million, or 21.5% lower than 2009, driven primarily by
lower referrals for residential mortgage lending.
Noninterest expense incurred by Community Banking during 2011 declined $31 million, or 1.3%, to $2.4 billion
compared to 2010. The decline was primarily due to lower regulatory charges and personnel expense, partially offset by
higher foreclosed property expense. Comparing 2010 to 2009, noninterest expense increased $483 million, or 25.2%. This
increase was primarily due to higher foreclosed property expense, other real estate owned expense, and personnel
expense. Allocated corporate expense increased $95 million, or 12.3%, to $866 million in 2011, primarily due to increases
in loan administration expense, IT services and operations. Comparing 2010 to 2009, allocated corporate expenses
increased by $93 million, or 13.7%.
Total identifiable assets for Community Banking decreased $2.3 billion in 2011, or 3.6%, to $60.9 billion, compared to a
decrease of $3.1 billion, or 4.6%, in 2010. The loan portfolios declined due to the sale of specific nonperforming commercial
loans, the general economic conditions, and lack of strong demand for lending products during 2011 and 2010. Community
Banking experienced solid organic deposit growth during 2011, excluding the decline in higher-cost certificates of deposit.
Residential Mortgage Banking
BB&T’s mortgage originations totaled $23.7 billion in 2011, down $1.2 billion, or 4.8%, compared to 2010. BB&T’s
residential mortgage servicing portfolio, which includes both retained loans and loans serviced for third parties, totaled $91.6
billion at year end 2011, an increase of 9.8%, compared to $83.5 billion at December 31, 2010. Residential Mortgage
Banking experienced a net loss of $17 million in 2011, compared to a net loss of $77 million in 2010. This improvement in
performance was primarily due to a significant decline in the allocated provision for loan and lease losses. Net income in
2009 was $208 million, due to strong growth in loan originations during the year. The decline in net income in 2010
compared to 2009 was primarily due to a significant increase in the allocated provision for loan and lease losses.
46