BB&T 2011 Annual Report Download - page 107
Download and view the complete annual report
Please find page 107 of the 2011 BB&T annual report below. You can navigate through the pages in the report by either clicking on the pages listed below, or by using the keyword search tool below to find specific information within the annual report.-
 1
1 -
2
-
3
-
4
-
5
-
6
-
7
-
8
-
9
-
10
-
11
-
12
-
13
-
14
-
15
-
16
-
17
-
18
-
19
-
20
-
21
-
22
-
23
-
24
-
25
-
26
-
27
-
28
-
29
-
30
-
31
-
32
-
33
-
34
-
35
-
36
-
37
-
38
-
39
-
40
-
41
-
42
-
43
-
44
-
45
-
46
-
47
-
48
-
49
-
50
-
51
-
52
-
53
-
54
-
55
-
56
-
57
-
58
-
59
-
60
-
61
-
62
-
63
-
64
-
65
-
66
-
67
-
68
-
69
-
70
-
71
-
72
-
73
-
74
-
75
-
76
-
77
-
78
-
79
-
80
-
81
-
82
-
83
-
84
-
85
-
86
-
87
-
88
-
89
-
90
-
91
-
92
-
93
-
94
-
95
-
96
-
 97
97 -
 98
98 -
 99
99 -
 100
100 -
 101
101 -
 102
102 -
 103
103 -
 104
104 -
 105
105 -
 106
106 -
 107
107 -
 108
108 -
 109
109 -
 110
110 -
 111
111 -
 112
112 -
 113
113 -
 114
114 -
 115
115 -
 116
116 -
 117
117 -
118
-
119
-
120
-
121
-
122
-
123
-
124
-
125
-
126
-
127
-
128
-
129
-
130
-
131
-
132
-
133
-
134
-
135
-
136
-
137
-
138
-
139
-
140
-
141
-
142
-
143
-
144
-
145
-
146
-
147
-
148
-
149
-
150
-
151
-
152
-
153
-
154
-
155
-
156
-
157
-
158
-
159
-
160
-
161
-
162
-
163
 |
 |

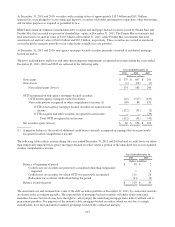
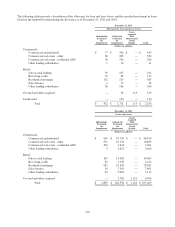
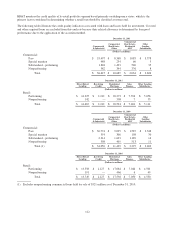
Changes in the carrying amount and accretable yield for purchased impaired and nonimpaired loans were as follows for
the years ended December 31, 2011 and 2010:
December 31, 2011 December 31, 2010
Purchased Impaired Purchased Nonimpaired Purchased Impaired Purchased Nonimpaired
Accretable
Yield
Carrying
Amount
of Loans
Accretable
Yield
Carrying
Amount
of Loans
Accretable
Yield
Carrying
Amount
of Loans
Accretable
Yield
Carrying
Amount
of Loans
(Dollars in millions)
Balance at beginning of period $ 835 $ 2,858 $ 1,611 $ 3,394 $ 889 $ 3,666 $ 1,301 $ 4,476
Additions ————————
Accretion (359) 359 (706) 706 (459) 459 (483) 483
Reclassifications from
nonaccretable balance,
net 45 — 334 — 405 — 793 —
Payments received, net — (1,093) — (1,318) — (1,267) — (1,565)
Balance at end of period $ 521 $ 2,124 $ 1,239 $ 2,782 $ 835 $ 2,858 $ 1,611 $ 3,394
The outstanding unpaid principal balance for all purchased impaired loans as of December 31, 2011 and 2010 was
$3.3 billion and $4.7 billion, respectively. The outstanding unpaid principal balance for all purchased nonimpaired loans
as of December 31, 2011 and 2010 was $3.9 billion and $5.2 billion, respectively.
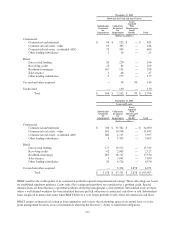
At December 31, 2011 and 2010, none of the purchased loans were classified as nonperforming assets. Therefore, interest
income, through accretion of the difference between the carrying amount of the loans and the expected cash flows, is
being recognized on all purchased loans. The allowance for loan losses related to the purchased loans results from
decreased expectations of future cash flows due to increased credit losses for certain acquired loan pools.
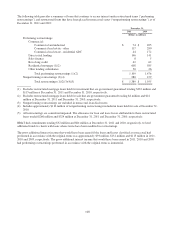
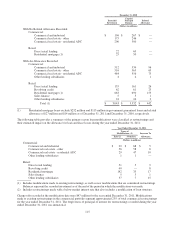
The following table provides a summary of BB&T’s nonperforming assets and loans 90 days or more past due and still
accruing as of December 31, 2011 and 2010:
December 31,
2011 2010
(Dollars in millions)
Nonaccrual loans and leases:
Held for investment (1) $ 1,872 $ 2,149
Held for sale — 521
Total nonaccrual loans and leases (1) 1,872 2,670
Foreclosed real estate (2) 536 1,259
Other foreclosed property 42 42
Total foreclosed property (2) 578 1,301
Total nonperforming assets (excluding covered assets) (1)(2) $ 2,450 $ 3,971
Loans 90 days or more past due and still accruing (excluding covered loans) (3)(4)(5) $ 202 $ 295
(1) Covered and other acquired loans are considered to be performing due to the application of the accretion method.
Covered loans that are contractually 90 days or more past due and still accruing are noted below.
(2) Excludes foreclosed real estate totaling $378 million and $313 million as of December 31, 2011 and December 31,
2010, respectively, that is covered by FDIC loss sharing agreements.
(3) Excludes mortgage loans guaranteed by GNMA that BB&T does not have the obligation to repurchase totaling $426
million and $425 million as of December 31, 2011 and December 31, 2010, respectively.
(4) Excludes loans 90 days or more past due that are covered by FDIC loss sharing agreements totaling $736 million and
$1.1 billion as of December 31, 2011 and December 31, 2010, respectively.
(5) Excludes mortgage loans 90 days or more past due that are government guaranteed totaling $206 million and $153
million as of December 31, 2011 and December 31, 2010, respectively.
107