BB&T 2011 Annual Report Download - page 39
Download and view the complete annual report
Please find page 39 of the 2011 BB&T annual report below. You can navigate through the pages in the report by either clicking on the pages listed below, or by using the keyword search tool below to find specific information within the annual report.-
 1
1 -
2
-
3
-
4
-
5
-
6
-
7
-
8
-
9
-
10
-
11
-
12
-
13
-
14
-
15
-
16
-
17
-
18
-
19
-
20
-
21
-
22
-
23
-
24
-
25
-
26
-
27
-
28
-
 29
29 -
 30
30 -
 31
31 -
 32
32 -
 33
33 -
 34
34 -
 35
35 -
 36
36 -
 37
37 -
 38
38 -
 39
39 -
 40
40 -
 41
41 -
 42
42 -
 43
43 -
 44
44 -
 45
45 -
 46
46 -
 47
47 -
 48
48 -
 49
49 -
50
-
51
-
52
-
53
-
54
-
55
-
56
-
57
-
58
-
59
-
60
-
61
-
62
-
63
-
64
-
65
-
66
-
67
-
68
-
69
-
70
-
71
-
72
-
73
-
74
-
75
-
76
-
77
-
78
-
79
-
80
-
81
-
82
-
83
-
84
-
85
-
86
-
87
-
88
-
89
-
90
-
91
-
92
-
93
-
94
-
95
-
96
-
97
-
98
-
99
-
100
-
101
-
102
-
103
-
104
-
105
-
106
-
107
-
108
-
109
-
110
-
111
-
112
-
113
-
114
-
115
-
116
-
117
-
118
-
119
-
120
-
121
-
122
-
123
-
124
-
125
-
126
-
127
-
128
-
129
-
130
-
131
-
132
-
133
-
134
-
135
-
136
-
137
-
138
-
139
-
140
-
141
-
142
-
143
-
144
-
145
-
146
-
147
-
148
-
149
-
150
-
151
-
152
-
153
-
154
-
155
-
156
-
157
-
158
-
159
-
160
-
161
-
162
-
163
 |
 |

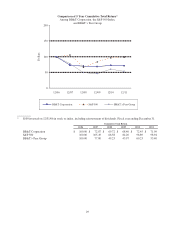
Table 7
FTE Net Interest Income and Rate / Volume Analysis
Years Ended December 31, 2011, 2010 and 2009
2011 vs. 2010 2010 vs. 2009
Average Balances Yield/Rate Income/Expense Increase Change due to Increase Change due to
2011 2010 2009 2011 2010 2009 2011 2010 2009 (Decrease) Rate Volume (Decrease) Rate Volume
(Dollars in millions)
Assets
Total securities, at amortized cost: (1)(2)
U.S. government-sponsored entities (GSE) $ 288 $ 568 $ 1,400 1.52 % 3.67 % 3.86 % $ 4 $ 21 $ 54 $ (17) $ (9) $ (8) $ (33) $ (2) $ (31)
Mortgage-backed securities issued by GSE 25,305 22,310 25,419 1.86 3.24 4.14 472 723 1,052 (251) (338) 87 (329) (211) (118)
States and political subdivisions 1,895 2,047 2,218 5.72 5.49 5.67 109 112 126 (3) 5 (8) (14) (5) (9)
Non-agency mortgage-backed securities 528 1,174 1,447 6.72 5.87 5.82 35 69 84 (34) 9 (43) (15) 1 (16)
Other securities 658 313 302 1.55 2.16 3.90 10 7 12 3 (2) 5 (5) (5) —
Covered securities 1,249 1,198 440 13.46 11.84 11.35 168 142 50 26 20 6 92 2 90
Total securities 29,923 27,610 31,226 2.67 3.89 4.41 798 1,074 1,378 (276) (315) 39 (304) (220) (84)
Other earning assets (3) 3,207 2,933 2,293 0.62 0.55 0.79 20 17 18 3 1 2 (1) (6) 5
Loans and leases, net of unearned income: (1)(4)(5)
Commercial loans and leases 48,061 48,777 50,074 4.09 4.23 4.21 1,968 2,063 2,110 (95) (65) (30) (47) 8 (55)
Direct retail lending 13,800 13,948 14,730 5.11 5.29 5.47 705 737 806 (32) (24) (8) (69) (27) (42)
Sales finance 7,202 6,766 6,392 4.88 5.87 6.46 352 397 413 (45) (69) 24 (16) (39) 23
Revolving credit 2,106 2,032 1,855 8.77 8.74 9.51 185 178 176 7 1 6 2 (15) 17
Residential mortgage 18,782 15,965 15,927 4.80 5.38 5.72 902 859 911 43 (99) 142 (52) (54) 2
Other lending subsidiaries 8,280 7,778 7,141 11.51 11.46 11.51 953 892 822 61 4 57 70 (4) 74
Other acquired 50 85 52 34.10 16.43 10.81 17 14 6 3 10 (7) 8 4 4
Total loans and leases held for investment (excluding covered loans) 98,281 95,351 96,171 5.17 5.39 5.45 5,082 5,140 5,244 (58) (242) 184 (104) (127) 23
Covered loans 5,498 7,059 3,144 19.15 13.22 7.39 1,053 933 232 120 357 (237) 701 272 429
Total loans and leases held for investment 103,779 102,410 99,315 5.91 5.93 5.51 6,135 6,073 5,476 62 115 (53) 597 145 452
Loans held for sale 2,183 2,377 2,831 3.75 3.80 4.81 82 90 136 (8) (1) (7) (46) (26) (20)
Total loans and leases 105,962 104,787 102,146 5.87 5.88 5.49 6,217 6,163 5,612 54 114 (60) 551 119 432
Total earning assets 139,092 135,330 135,665 5.06 5.36 5.17 7,035 7,254 7,008 (219) (200) (19) 246 (107) 353
Nonearning assets 23,874 24,328 19,517
Total assets $ 162,966 $ 159,658 $ 155,182
Liabilities and Shareholders’ Equity
Interest-bearing deposits:
Interest-checking $ 18,614 $ 16,477 $ 14,688 0.16 0.17 0.22 30 29 33 1 (2) 3 (4) (8) 4
Money market and savings 41,287 34,942 30,097 0.31 0.50 0.76 129 175 228 (46) (74) 28 (53) (86) 33
Certificates and other time deposits 28,825 33,699 38,083 1.57 2.12 2.61 453 715 994 (262) (168) (94) (279) (173) (106)
Foreign office deposits - interest-bearing 647 1,913 3,126 (0.37) (0.11) 0.51 (2) (2) 16 — (2) 2 (18) (14) (4)
Total interest-bearing deposits 89,373 87,031 85,994 0.68 1.05 1.48 610 917 1,271 (307) (246) (61) (354) (281) (73)
Federal funds purchased, securities sold under repurchase agreements and short-
term borrowed funds (1) 5,189 9,022 12,491 0.27 0.28 0.50 14 26 63 (12) (1) (11) (37) (23) (14)
Long-term debt 22,257 21,653 19,085 3.40 3.96 3.73 757 856 711 (99) (122) 23 145 46 99
Total interest-bearing liabilities 116,819 117,706 117,570 1.18 1.53 1.74 1,381 1,799 2,045 (418) (369) (49) (246) (258) 12
Noninterest-bearing deposits 22,945 19,742 16,387
Other liabilities 5,935 5,324 4,987
Shareholders’ equity 17,267 16,886 16,238
Total liabilities and shareholders’ equity $ 162,966 $ 159,658 $ 155,182
Average interest rate spread 3.88 % 3.83 % 3.43 %
Net interest margin/ net interest income 4.06 % 4.03 % 3.66 % $ 5,654 $ 5,455 $ 4,963 $ 199 $ 169 $ 30 $ 492 $ 151 $ 341
Taxable-equivalent adjustment $ 147 $ 135 $ 119
(1) Yields are stated on a taxable equivalent basis assuming tax rates in effect for the periods presented.
(2) Total securities include securities available for sale and securities held to maturity.
(3) Includes Federal funds sold, securities purchased under resale agreements or similar arrangements, interest-bearing deposits with banks, trading securities, FHLB stock and other earning assets.
(4) Loan fees, which are not material for any of the periods shown, have been included for rate calculation purposes.
(5) Nonaccrual loans have been included in the average balances.
39