BB&T 2011 Annual Report Download - page 83
Download and view the complete annual report
Please find page 83 of the 2011 BB&T annual report below. You can navigate through the pages in the report by either clicking on the pages listed below, or by using the keyword search tool below to find specific information within the annual report.-
 1
1 -
2
-
3
-
4
-
5
-
6
-
7
-
8
-
9
-
10
-
11
-
12
-
13
-
14
-
15
-
16
-
17
-
18
-
19
-
20
-
21
-
22
-
23
-
24
-
25
-
26
-
27
-
28
-
29
-
30
-
31
-
32
-
33
-
34
-
35
-
36
-
37
-
38
-
39
-
40
-
41
-
42
-
43
-
44
-
45
-
46
-
47
-
48
-
49
-
50
-
51
-
52
-
53
-
54
-
55
-
56
-
57
-
58
-
59
-
60
-
61
-
62
-
63
-
64
-
65
-
66
-
67
-
68
-
69
-
70
-
71
-
72
-
 73
73 -
 74
74 -
 75
75 -
 76
76 -
 77
77 -
 78
78 -
 79
79 -
 80
80 -
 81
81 -
 82
82 -
 83
83 -
 84
84 -
 85
85 -
 86
86 -
 87
87 -
 88
88 -
 89
89 -
 90
90 -
 91
91 -
 92
92 -
 93
93 -
94
-
95
-
96
-
97
-
98
-
99
-
100
-
101
-
102
-
103
-
104
-
105
-
106
-
107
-
108
-
109
-
110
-
111
-
112
-
113
-
114
-
115
-
116
-
117
-
118
-
119
-
120
-
121
-
122
-
123
-
124
-
125
-
126
-
127
-
128
-
129
-
130
-
131
-
132
-
133
-
134
-
135
-
136
-
137
-
138
-
139
-
140
-
141
-
142
-
143
-
144
-
145
-
146
-
147
-
148
-
149
-
150
-
151
-
152
-
153
-
154
-
155
-
156
-
157
-
158
-
159
-
160
-
161
-
162
-
163
 |
 |

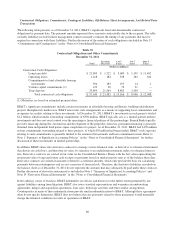
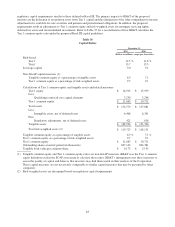
regulatory capital requirements similar to those defined in Basel III. The primary impacts to BB&T of the proposed
measure are the deduction of net pension assets from Tier 1 capital and the elimination of the other comprehensive income
adjustments for available-for-sale securities and pension and postretirement obligations. In addition, the proposed
requirements result in adjustments to Tier 1 common equity and risk-weighted assets for mortgage servicing rights,
deferred tax assets and unconsolidated investments. Refer to Table 37 for a reconciliation of how BB&T calculates the
Tier 1 common equity ratio under the proposed Basel III capital guidelines.
Table 36
Capital Ratios
December 31,
2011 2010
(Dollars in millions, except per share data)
Risk-based:
Tier 1 12.5 % 11.8 %
Total 15.7 15.5
Leverage capital 9.0 9.1
Non-GAAP capital measures (1):
Tangible common equity as a percentage of tangible assets 6.9 7.1
Tier 1 common equity as a percentage of risk-weighted assets 9.7 9.1
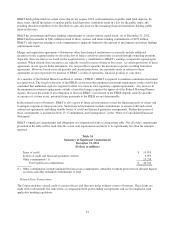
Calculations of Tier 1 common equity and tangible assets and related measures:
Tier 1 equity $ 14,913 $ 13,959
Less:
Qualifying restricted core capital elements 3,250 3,248
Tier 1 common equity $ 11,663 $ 10,711
Total assets $ 174,579 $ 157,081
Less:
Intangible assets, net of deferred taxes 6,406 6,391
Plus:
Regulatory adjustments, net of deferred taxes 421 636
Tangible assets $ 168,594 $ 151,326
Total risk-weighted assets (2) $ 119,725 $ 118,131
Tangible common equity as a percentage of tangible assets 6.9 % 7.1 %
Tier 1 common equity as a percentage of risk-weighted assets 9.7 9.1
Tier 1 common equity $ 11,663 $ 10,711
Outstanding shares at end of period (in thousands) 697,143 694,381
Tangible book value per common share $ 16.73 $ 15.43
(1) Tangible common equity and Tier 1 common equity ratios are non-GAAP measures. BB&T uses the Tier 1 common
equity definition used in the SCAP assessment to calculate these ratios. BB&T’s management uses these measures to
assess the quality of capital and believes that investors may find them useful in their analysis of the Corporation.
These capital measures are not necessarily comparable to similar capital measures that may be presented by other
companies.
(2) Risk-weighted assets are determined based on regulatory capital requirements.
83