BB&T 2011 Annual Report Download - page 112
Download and view the complete annual report
Please find page 112 of the 2011 BB&T annual report below. You can navigate through the pages in the report by either clicking on the pages listed below, or by using the keyword search tool below to find specific information within the annual report.-
 1
1 -
2
-
3
-
4
-
5
-
6
-
7
-
8
-
9
-
10
-
11
-
12
-
13
-
14
-
15
-
16
-
17
-
18
-
19
-
20
-
21
-
22
-
23
-
24
-
25
-
26
-
27
-
28
-
29
-
30
-
31
-
32
-
33
-
34
-
35
-
36
-
37
-
38
-
39
-
40
-
41
-
42
-
43
-
44
-
45
-
46
-
47
-
48
-
49
-
50
-
51
-
52
-
53
-
54
-
55
-
56
-
57
-
58
-
59
-
60
-
61
-
62
-
63
-
64
-
65
-
66
-
67
-
68
-
69
-
70
-
71
-
72
-
73
-
74
-
75
-
76
-
77
-
78
-
79
-
80
-
81
-
82
-
83
-
84
-
85
-
86
-
87
-
88
-
89
-
90
-
91
-
92
-
93
-
94
-
95
-
96
-
97
-
98
-
99
-
100
-
101
-
 102
102 -
 103
103 -
 104
104 -
 105
105 -
 106
106 -
 107
107 -
 108
108 -
 109
109 -
 110
110 -
 111
111 -
 112
112 -
 113
113 -
 114
114 -
 115
115 -
 116
116 -
 117
117 -
 118
118 -
 119
119 -
 120
120 -
 121
121 -
 122
122 -
123
-
124
-
125
-
126
-
127
-
128
-
129
-
130
-
131
-
132
-
133
-
134
-
135
-
136
-
137
-
138
-
139
-
140
-
141
-
142
-
143
-
144
-
145
-
146
-
147
-
148
-
149
-
150
-
151
-
152
-
153
-
154
-
155
-
156
-
157
-
158
-
159
-
160
-
161
-
162
-
163
 |
 |

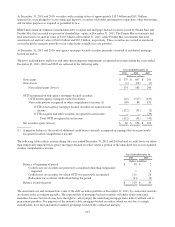
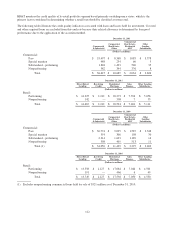
BB&T monitors the credit quality of its retail portfolio segment based primarily on delinquency status, which is the
primary factor considered in determining whether a retail loan should be classified as nonaccrual.
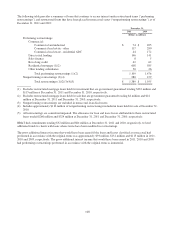
The following tables illustrate the credit quality indicators associated with loans and leases held for investment. Covered
and other acquired loans are excluded from this analysis because their related allowance is determined by loan pool
performance due to the application of the accretion method.
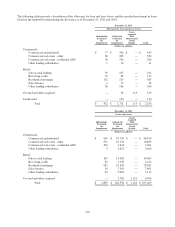
December 31, 2011
Commercial
& Industrial
Commercial
Real Estate -
Other
Commercial
Real Estate -
Residential
ADC
Other
Lending
Subsidiaries
(Dollars in millions)
Commercial:
Pass $ 33,497 $ 8,568 $ 1,085 $ 3,578
Special mention 488 234 60 5
Substandard - performing 1,848 1,493 540 35
Nonperforming 582 394 376 8
Total $ 36,415 $ 10,689 $ 2,061 $ 3,626
December 31, 2011
Direct Retail
Lending
Revolving
Credit
Residential
Mortgage
Sales
Finance
Other Lending
Subsidiaries
(Dollars in millions)
Retail:
Performing $ 14,325 $ 2,212 $ 20,273 $ 7,394 $ 5,056
Nonperforming 142 — 308 7 55
Total $ 14,467 $ 2,212 $ 20,581 $ 7,401 $ 5,111
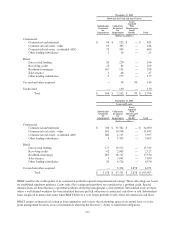
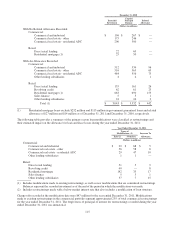
December 31, 2010
Commercial
& Industrial
Commercial
Real Estate -
Other
Commercial
Real Estate -
Residential
ADC
Other
Lending
Subsidiaries
(Dollars in millions)
Commercial:
Pass $ 30,774 $ 9,095 $ 1,587 $ 3,348
Special mention 554 306 108 30
Substandard - performing 2,214 1,633 1,189 14
Nonperforming 508 405 513 11
Total (1) $ 34,050 $ 11,439 $ 3,397 $ 3,403
December 31, 2010
Direct Retail
Lending
Revolving
Credit
Residential
Mortgage
Sales
Finance
Other Lending
Subsidiaries
(Dollars in millions)
Retail:
Performing $ 13,558 $ 2,127 $ 17,084 $ 7,044 $ 4,501
Nonperforming 191 — 466 6 49
Total $ 13,749 $ 2,127 $ 17,550 $ 7,050 $ 4,550
(1) Excludes nonperforming commercial loans held for sale of $521 million as of December 31, 2010.
112