BB&T 2011 Annual Report Download - page 51
Download and view the complete annual report
Please find page 51 of the 2011 BB&T annual report below. You can navigate through the pages in the report by either clicking on the pages listed below, or by using the keyword search tool below to find specific information within the annual report.-
 1
1 -
2
-
3
-
4
-
5
-
6
-
7
-
8
-
9
-
10
-
11
-
12
-
13
-
14
-
15
-
16
-
17
-
18
-
19
-
20
-
21
-
22
-
23
-
24
-
25
-
26
-
27
-
28
-
29
-
30
-
31
-
32
-
33
-
34
-
35
-
36
-
37
-
38
-
39
-
40
-
 41
41 -
 42
42 -
 43
43 -
 44
44 -
 45
45 -
 46
46 -
 47
47 -
 48
48 -
 49
49 -
 50
50 -
 51
51 -
 52
52 -
 53
53 -
 54
54 -
 55
55 -
 56
56 -
 57
57 -
 58
58 -
 59
59 -
 60
60 -
 61
61 -
62
-
63
-
64
-
65
-
66
-
67
-
68
-
69
-
70
-
71
-
72
-
73
-
74
-
75
-
76
-
77
-
78
-
79
-
80
-
81
-
82
-
83
-
84
-
85
-
86
-
87
-
88
-
89
-
90
-
91
-
92
-
93
-
94
-
95
-
96
-
97
-
98
-
99
-
100
-
101
-
102
-
103
-
104
-
105
-
106
-
107
-
108
-
109
-
110
-
111
-
112
-
113
-
114
-
115
-
116
-
117
-
118
-
119
-
120
-
121
-
122
-
123
-
124
-
125
-
126
-
127
-
128
-
129
-
130
-
131
-
132
-
133
-
134
-
135
-
136
-
137
-
138
-
139
-
140
-
141
-
142
-
143
-
144
-
145
-
146
-
147
-
148
-
149
-
150
-
151
-
152
-
153
-
154
-
155
-
156
-
157
-
158
-
159
-
160
-
161
-
162
-
163
 |
 |
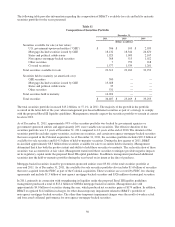
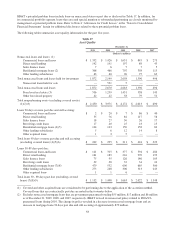
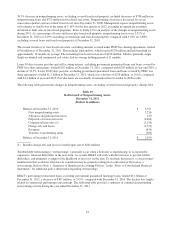
In 2010, management executed two major strategies to strengthen the balance sheet. In the second quarter of 2010,
management executed a deleveraging strategy to better position BB&T’s balance sheet for a rising rate environment and
achieve a better mix of earning assets. In connection with this strategy, management reduced the balance sheet by
approximately $8 billion through the sale of securities. During the third and fourth quarters of 2010, management
executed a strategy to further de-risk the available-for-sale securities portfolio. The de-risking strategy was aimed at
further reducing the duration of the securities portfolio and reducing the risk of charges to other comprehensive income in
a rising rate environment. Also to further protect against the risk of a rising rate environment, management replaced a
portion of the securities sold with floating-rate securities. As of December 31, 2010, approximately 28% of the
available-for-sale securities portfolio was floating rate. In addition, management sold approximately $400 million of
non-agency mortgage-backed securities to reduce the potential for future credit losses. These strategies were the primary
driver in generating net securities gains during 2010. Primarily in connection with these strategies, BB&T sold a total of
$31.3 billion in available-for-sale securities during 2010, which produced net securities gains of $585 million. In addition,
BB&T recognized $31 million in charges for other-than-temporary impairment related to BB&T’s portfolio of non-agency
mortgage-backed securities.
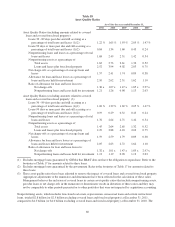
Refer to Note 2 “Securities” in the “Notes to Consolidated Financial Statements” herein for additional disclosures related
to BB&T’s evaluation of securities for other-than-temporary impairment.
51