BB&T 2011 Annual Report Download - page 88
Download and view the complete annual report
Please find page 88 of the 2011 BB&T annual report below. You can navigate through the pages in the report by either clicking on the pages listed below, or by using the keyword search tool below to find specific information within the annual report.-
 1
1 -
2
-
3
-
4
-
5
-
6
-
7
-
8
-
9
-
10
-
11
-
12
-
13
-
14
-
15
-
16
-
17
-
18
-
19
-
20
-
21
-
22
-
23
-
24
-
25
-
26
-
27
-
28
-
29
-
30
-
31
-
32
-
33
-
34
-
35
-
36
-
37
-
38
-
39
-
40
-
41
-
42
-
43
-
44
-
45
-
46
-
47
-
48
-
49
-
50
-
51
-
52
-
53
-
54
-
55
-
56
-
57
-
58
-
59
-
60
-
61
-
62
-
63
-
64
-
65
-
66
-
67
-
68
-
69
-
70
-
71
-
72
-
73
-
74
-
75
-
76
-
77
-
 78
78 -
 79
79 -
 80
80 -
 81
81 -
 82
82 -
 83
83 -
 84
84 -
 85
85 -
 86
86 -
 87
87 -
 88
88 -
 89
89 -
 90
90 -
 91
91 -
 92
92 -
 93
93 -
 94
94 -
 95
95 -
 96
96 -
 97
97 -
 98
98 -
99
-
100
-
101
-
102
-
103
-
104
-
105
-
106
-
107
-
108
-
109
-
110
-
111
-
112
-
113
-
114
-
115
-
116
-
117
-
118
-
119
-
120
-
121
-
122
-
123
-
124
-
125
-
126
-
127
-
128
-
129
-
130
-
131
-
132
-
133
-
134
-
135
-
136
-
137
-
138
-
139
-
140
-
141
-
142
-
143
-
144
-
145
-
146
-
147
-
148
-
149
-
150
-
151
-
152
-
153
-
154
-
155
-
156
-
157
-
158
-
159
-
160
-
161
-
162
-
163
 |
 |

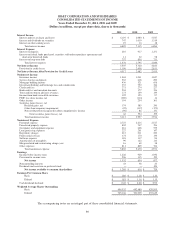
BB&T CORPORATION AND SUBSIDIARIES
CONSOLIDATED BALANCE SHEETS
December 31, 2011 and 2010
(Dollars in millions, except per share data, shares in thousands)
2011 2010
Assets
Cash and due from banks $ 1,562 $ 1,127
Interest-bearing deposits with banks 2,646 931
Federal funds sold and securities purchased under resale agreements or similar
arrangements 136 327
Segregated cash due from banks 20 309
Trading securities at fair value 534 633
Securities available for sale at fair value ($1,577 and $1,539 covered by FDIC loss
share at December 31, 2011 and December 31, 2010, respectively) 22,313 23,169
Securities held to maturity (fair value of $14,098 at December 31, 2011) 14,094 —
Loans held for sale ($3,736 and $3,176 at fair value at December 31, 2011 and
December 31, 2010, respectively) 3,736 3,697
Loans and leases ($4,867 and $6,194 covered by FDIC loss share at December 31,
2011 and December 31, 2010, respectively) 107,469 103,567
Allowance for loan and lease losses (2,256) (2,708)
Loans and leases, net of allowance for loan and lease losses 105,213 100,859
FDIC loss share receivable 1,100 1,922
Premises and equipment 1,855 1,840
Goodwill 6,078 6,008
Core deposit and other intangible assets 444 508
Residential mortgage servicing rights at fair value 563 830
Other assets ($415 and $360 of foreclosed property and other assets covered by
FDIC loss share at December 31, 2011 and December 31, 2010, respectively) 14,285 14,921
Total assets $ 174,579 $ 157,081
Liabilities and Shareholders’ Equity
Deposits:
Noninterest-bearing deposits $ 25,684 $ 20,637
Interest-bearing deposits 99,255 86,576
Total deposits 124,939 107,213
Federal funds purchased, securities sold under repurchase agreements and short-
term borrowed funds 3,566 5,673
Long-term debt 21,803 21,730
Accounts payable and other liabilities 6,791 5,967
Total liabilities 157,099 140,583
Commitments and contingencies (Note 15)
Shareholders’ equity:
Common stock, $5 par 3,486 3,472
Additional paid-in capital 5,873 5,776
Retained earnings 8,772 7,935
Accumulated other comprehensive loss, net of deferred income taxes (713) (747)
Noncontrolling interests 62 62
Total shareholders’ equity 17,480 16,498
Total liabilities and shareholders’ equity $ 174,579 $ 157,081
Common shares outstanding 697,143 694,381
Common shares authorized 2,000,000 2,000,000
Preferred shares authorized 5,000 5,000
The accompanying notes are an integral part of these consolidated financial statements.
88