BB&T 2011 Annual Report Download - page 61
Download and view the complete annual report
Please find page 61 of the 2011 BB&T annual report below. You can navigate through the pages in the report by either clicking on the pages listed below, or by using the keyword search tool below to find specific information within the annual report.-
 1
1 -
2
-
3
-
4
-
5
-
6
-
7
-
8
-
9
-
10
-
11
-
12
-
13
-
14
-
15
-
16
-
17
-
18
-
19
-
20
-
21
-
22
-
23
-
24
-
25
-
26
-
27
-
28
-
29
-
30
-
31
-
32
-
33
-
34
-
35
-
36
-
37
-
38
-
39
-
40
-
41
-
42
-
43
-
44
-
45
-
46
-
47
-
48
-
49
-
50
-
 51
51 -
 52
52 -
 53
53 -
 54
54 -
 55
55 -
 56
56 -
 57
57 -
 58
58 -
 59
59 -
 60
60 -
 61
61 -
 62
62 -
 63
63 -
 64
64 -
 65
65 -
 66
66 -
 67
67 -
 68
68 -
 69
69 -
 70
70 -
 71
71 -
72
-
73
-
74
-
75
-
76
-
77
-
78
-
79
-
80
-
81
-
82
-
83
-
84
-
85
-
86
-
87
-
88
-
89
-
90
-
91
-
92
-
93
-
94
-
95
-
96
-
97
-
98
-
99
-
100
-
101
-
102
-
103
-
104
-
105
-
106
-
107
-
108
-
109
-
110
-
111
-
112
-
113
-
114
-
115
-
116
-
117
-
118
-
119
-
120
-
121
-
122
-
123
-
124
-
125
-
126
-
127
-
128
-
129
-
130
-
131
-
132
-
133
-
134
-
135
-
136
-
137
-
138
-
139
-
140
-
141
-
142
-
143
-
144
-
145
-
146
-
147
-
148
-
149
-
150
-
151
-
152
-
153
-
154
-
155
-
156
-
157
-
158
-
159
-
160
-
161
-
162
-
163
 |
 |

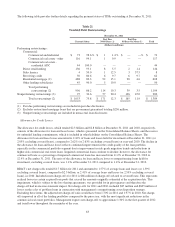
38.3% decrease in nonperforming assets, excluding covered foreclosed property, included decreases of $798 million in
nonperforming loans and $723 million in foreclosed real estate. Nonperforming assets have decreased for seven
consecutive quarters and are at their lowest level since December 31, 2008. Management expects nonperforming assets
will continue to trend lower in the range of 5-10% for the first quarter of 2012, assuming no significant economic
downturn or bulk sales of foreclosed properties. Refer to Table 19 for an analysis of the changes in nonperforming assets
during 2011. As a percentage of loans and leases plus foreclosed property, nonperforming assets were 2.52% at
December 31, 2011 (or 2.29% excluding covered loans and foreclosed property) compared with 3.94% (or 3.88%
excluding covered loans and foreclosed property) at December 31, 2010.
The current inventory of foreclosed real estate, excluding amounts covered under FDIC loss sharing agreements, totaled
$536 million as of December 31, 2011. This includes land and lots, which totaled $278 million and had been held for
approximately 16 months on average. The remaining foreclosed real estate of $258 million, which is primarily single
family residential and commercial real estate, had an average holding period of 11 months.
Loans 90 days or more past due and still accruing interest, excluding government guaranteed loans and loans covered by
FDIC loss share agreements, totaled $202 million at December 31, 2011, compared with $295 million at year-end 2010, a
decline of 31.5%. Loans 30-89 days past due, excluding government guaranteed loans and loans covered by FDIC loss
share agreements, totaled $1.1 billion at December 31, 2011, which was a decline of $276 million, or 19.6%, compared
with $1.4 billion at year-end 2010. Past due loans are essentially at normalized levels similar to 2006 results.
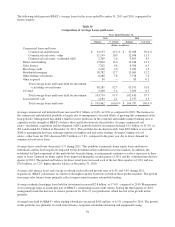
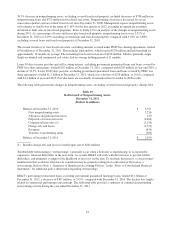
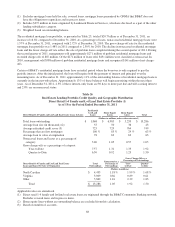
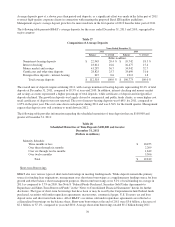
The following table presents the changes in nonperforming assets, excluding covered foreclosed property, during 2011.
Table 19
Rollforward of Nonperforming Assets
December 31, 2011
(Dollars in millions)
Balance at December 31, 2010 $ 3,971
New nonperforming assets 3,216
Advances and principal increases 120
Disposals of foreclosed assets (1,062)
Commercial loan sales (1) (1,139)
Charge-offs and losses (1,719)
Payments (634)
Transfers to performing status (303)
Balance at December 31, 2011 $ 2,450
(1) Includes charge-offs and losses recorded upon sale of $241 million
Troubled debt restructurings (“restructurings”) generally occur when a borrower is experiencing, or is expected to
experience, financial difficulties in the near-term. As a result, BB&T will work with the borrower to prevent further
difficulties, and ultimately to improve the likelihood of recovery on the loan. To facilitate this process, a concessionary
modification that would not otherwise be considered may be granted resulting in classification of the loan as a
restructuring. Refer to Note 1 “Summary of Significant Accounting Policies” in the “Notes to Consolidated Financial
Statements” for additional policy information regarding restructurings.
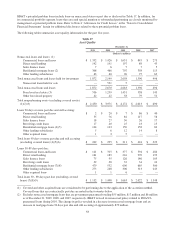
BB&T’s performing restructured loans, excluding government guaranteed mortgage loans, totaled $1.1 billion at
December 31, 2011, a decrease of $367 million, or 24.9%, compared with December 31, 2010. The decline was largely
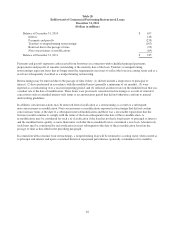
related to commercial performing restructurings. The following table provides a summary of commercial performing
restructuring activity during the year ended December 31, 2011.
61