BB&T 2011 Annual Report Download - page 135
Download and view the complete annual report
Please find page 135 of the 2011 BB&T annual report below. You can navigate through the pages in the report by either clicking on the pages listed below, or by using the keyword search tool below to find specific information within the annual report.-
 1
1 -
2
-
3
-
4
-
5
-
6
-
7
-
8
-
9
-
10
-
11
-
12
-
13
-
14
-
15
-
16
-
17
-
18
-
19
-
20
-
21
-
22
-
23
-
24
-
25
-
26
-
27
-
28
-
29
-
30
-
31
-
32
-
33
-
34
-
35
-
36
-
37
-
38
-
39
-
40
-
41
-
42
-
43
-
44
-
45
-
46
-
47
-
48
-
49
-
50
-
51
-
52
-
53
-
54
-
55
-
56
-
57
-
58
-
59
-
60
-
61
-
62
-
63
-
64
-
65
-
66
-
67
-
68
-
69
-
70
-
71
-
72
-
73
-
74
-
75
-
76
-
77
-
78
-
79
-
80
-
81
-
82
-
83
-
84
-
85
-
86
-
87
-
88
-
89
-
90
-
91
-
92
-
93
-
94
-
95
-
96
-
97
-
98
-
99
-
100
-
101
-
102
-
103
-
104
-
105
-
106
-
107
-
108
-
109
-
110
-
111
-
112
-
113
-
114
-
115
-
116
-
117
-
118
-
119
-
120
-
121
-
122
-
123
-
124
-
 125
125 -
 126
126 -
 127
127 -
 128
128 -
 129
129 -
 130
130 -
 131
131 -
 132
132 -
 133
133 -
 134
134 -
 135
135 -
 136
136 -
 137
137 -
 138
138 -
 139
139 -
 140
140 -
 141
141 -
 142
142 -
 143
143 -
 144
144 -
 145
145 -
146
-
147
-
148
-
149
-
150
-
151
-
152
-
153
-
154
-
155
-
156
-
157
-
158
-
159
-
160
-
161
-
162
-
163
 |
 |

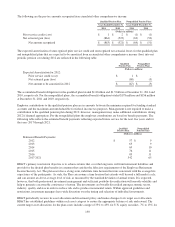
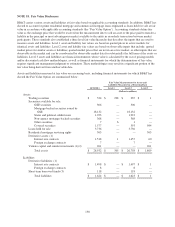
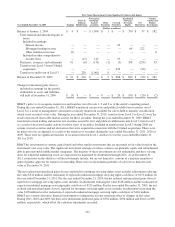
The following table provides summary information regarding regulatory capital for BB&T and Branch Bank as of
December 31, 2011 and 2010:
December 31, 2011 December 31, 2010
Actual Capital Capital Requirements Actual Capital Capital Requirements
Ratio Amount Minimum Well-Capitalized Ratio Amount Minimum Well-Capitalized
(Dollars in millions)
Tier 1 Capital:
BB&T 12.5 % $ 14,913 $ 4,789 $ 7,184 11.8 % $ 13,959 $ 4,725 $ 7,088
Branch Bank 13.4 15,274 4,567 6,851 13.0 14,650 4,499 6,749
Total Capital:
BB&T 15.7 18,802 9,578 11,973 15.5 18,319 9,450 11,813
Branch Bank 15.6 17,855 9,135 11,418 15.5 17,417 8,998 11,248
Leverage Capital:
BB&T 9.0 14,913 6,614 8,267 9.1 13,959 6,134 7,667
Branch Bank 9.5 15,274 4,801 8,002 9.9 14,650 4,425 7,375
As an approved seller/servicer, Branch Bank is required to maintain minimum levels of shareholders’ equity, as specified
by various agencies, including the United States Department of Housing and Urban Development, Government National
Mortgage Association, Federal Home Loan Mortgage Corporation and Federal National Mortgage Association. At
December 31, 2011 and 2010, Branch Bank’s equity was above all required levels.
At December 31, 2011 and 2010, BB&T had segregated cash deposits totaling $20 million and $309 million, respectively.
These deposits relate to monies held for the exclusive benefit of clients, primarily at BB&T’s broker/dealer subsidiaries.
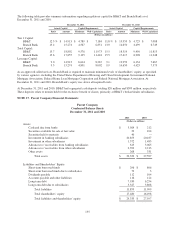
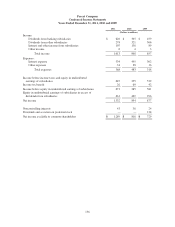
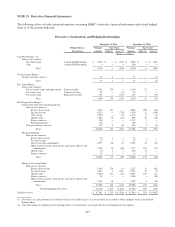
NOTE 17. Parent Company Financial Statements
Parent Company
Condensed Balance Sheets
December 31, 2011 and 2010
2011 2010
(Dollars in millions)
Assets:
Cash and due from banks $ 3,564 $ 212
Securities available for sale at fair value 29 104
Securities held to maturity 40 —
Investment in banking subsidiaries 20,853 20,187
Investment in other subsidiaries 1,572 1,485
Advances to / receivables from banking subsidiaries 615 3,065
Advances to / receivables from other subsidiaries 2,392 2,213
Other assets 268 331
Total assets $ 29,333 $ 27,597
Liabilities and Shareholders’ Equity:
Short-term borrowed funds $ 296 $ 806
Short-term borrowed funds due to subsidiaries 72 3
Dividends payable 112 104
Accounts payable and other liabilities 116 124
Long-term debt 7,930 6,254
Long-term debt due to subsidiaries 3,327 3,808
Total liabilities 11,853 11,099
Total shareholders’ equity 17,480 16,498
Total liabilities and shareholders’ equity $ 29,333 $ 27,597
135