BB&T 2011 Annual Report Download - page 141
Download and view the complete annual report
Please find page 141 of the 2011 BB&T annual report below. You can navigate through the pages in the report by either clicking on the pages listed below, or by using the keyword search tool below to find specific information within the annual report.-
 1
1 -
2
-
3
-
4
-
5
-
6
-
7
-
8
-
9
-
10
-
11
-
12
-
13
-
14
-
15
-
16
-
17
-
18
-
19
-
20
-
21
-
22
-
23
-
24
-
25
-
26
-
27
-
28
-
29
-
30
-
31
-
32
-
33
-
34
-
35
-
36
-
37
-
38
-
39
-
40
-
41
-
42
-
43
-
44
-
45
-
46
-
47
-
48
-
49
-
50
-
51
-
52
-
53
-
54
-
55
-
56
-
57
-
58
-
59
-
60
-
61
-
62
-
63
-
64
-
65
-
66
-
67
-
68
-
69
-
70
-
71
-
72
-
73
-
74
-
75
-
76
-
77
-
78
-
79
-
80
-
81
-
82
-
83
-
84
-
85
-
86
-
87
-
88
-
89
-
90
-
91
-
92
-
93
-
94
-
95
-
96
-
97
-
98
-
99
-
100
-
101
-
102
-
103
-
104
-
105
-
106
-
107
-
108
-
109
-
110
-
111
-
112
-
113
-
114
-
115
-
116
-
117
-
118
-
119
-
120
-
121
-
122
-
123
-
124
-
125
-
126
-
127
-
128
-
129
-
130
-
 131
131 -
 132
132 -
 133
133 -
 134
134 -
 135
135 -
 136
136 -
 137
137 -
 138
138 -
 139
139 -
 140
140 -
 141
141 -
 142
142 -
 143
143 -
 144
144 -
 145
145 -
 146
146 -
 147
147 -
 148
148 -
 149
149 -
 150
150 -
 151
151 -
152
-
153
-
154
-
155
-
156
-
157
-
158
-
159
-
160
-
161
-
162
-
163
 |
 |

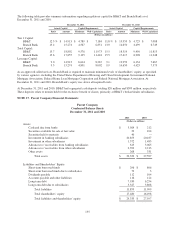
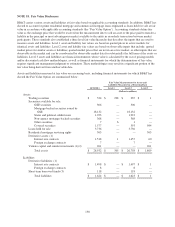
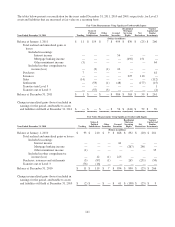
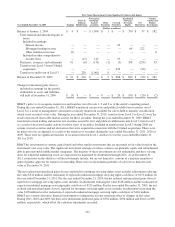
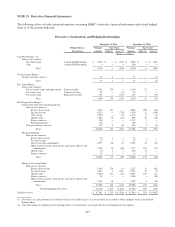
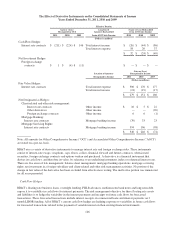
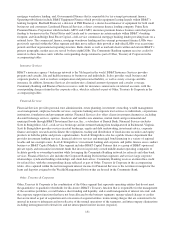
The tables below present a reconciliation for the years ended December 31, 2011, 2010 and 2009, respectively, for Level 3
assets and liabilities that are measured at fair value on a recurring basis.
Fair Value Measurements Using Significant Unobservable Inputs
Year Ended December 31, 2011 Trading
States &
Political
Subdivisions
Other
Securities
Covered
Securities
Residential
Mortgage
Servicing
Rights
Net
Derivatives
Venture
Capital and
Similar
Investments
(Dollars in millions)
Balance at January 1, 2011 $ 11 $ 119 $ 7 $ 954 $ 830 $ (25) $ 266
Total realized and unrealized gains or
losses:
Included in earnings:
Interest income — — — 54 — — —
Mortgage banking income — — — — (492) 151 —
Other noninterest income (3) — — — — — 64
Included in other comprehensive
income (loss) — (9) (1) 24 — — —
Purchases 7 — — — — — 61
Issuances — — — — 225 110 —
Sales (14) — — — — — (112)
Settlements — (53) (1) (48) — (177) (15)
Transfers into Level 3 — — — — — — 1
Transfers out of Level 3 — (57) (5) — — — (4)
Balance at December 31, 2011 $ 1 $ — $ — $ 984 $ 563 $ 59 $ 261
Change in unrealized gains (losses) included in
earnings for the period, attributable to assets
and liabilities still held at December 31, 2011 $ — $ — $ — $ 54 $ (341) $ 59 $ 39
Fair Value Measurements Using Significant Unobservable Inputs
Year Ended December 31, 2010 Trading
States &
Political
Subdivisions
Other
Securities
Covered
Securities
Residential
Mortgage
Servicing
Rights
Net
Derivatives
Venture
Capital and
Similar
Investments
(Dollars in millions)
Balance at January 1, 2010 $ 93 $ 210 $ 9 $ 668 $ 832 $ (20) $ 281
Total realized and unrealized gains or losses:
Included in earnings:
Interest income — — — 61 — — —
Mortgage banking income — — — — (267) 246 —
Other noninterest income (1) — — — — — 35
Included in other comprehensive
income (loss) — 12 (1) 225 — — —
Purchases, issuances and settlements (5) (87) (1) — 265 (251) (50)
Transfers out of Level 3 (76) (16) — — — — —
Balance at December 31, 2010 $ 11 $ 119 $ 7 $ 954 $ 830 $ (25) $ 266
Change in unrealized gains (losses) included in
earnings for the period, attributable to assets
and liabilities still held at December 31, 2010 $ (2) $ — $ — $ 61 $ (138) $ (25) $ 9
141