BB&T 2011 Annual Report Download - page 124
Download and view the complete annual report
Please find page 124 of the 2011 BB&T annual report below. You can navigate through the pages in the report by either clicking on the pages listed below, or by using the keyword search tool below to find specific information within the annual report.-
 1
1 -
2
-
3
-
4
-
5
-
6
-
7
-
8
-
9
-
10
-
11
-
12
-
13
-
14
-
15
-
16
-
17
-
18
-
19
-
20
-
21
-
22
-
23
-
24
-
25
-
26
-
27
-
28
-
29
-
30
-
31
-
32
-
33
-
34
-
35
-
36
-
37
-
38
-
39
-
40
-
41
-
42
-
43
-
44
-
45
-
46
-
47
-
48
-
49
-
50
-
51
-
52
-
53
-
54
-
55
-
56
-
57
-
58
-
59
-
60
-
61
-
62
-
63
-
64
-
65
-
66
-
67
-
68
-
69
-
70
-
71
-
72
-
73
-
74
-
75
-
76
-
77
-
78
-
79
-
80
-
81
-
82
-
83
-
84
-
85
-
86
-
87
-
88
-
89
-
90
-
91
-
92
-
93
-
94
-
95
-
96
-
97
-
98
-
99
-
100
-
101
-
102
-
103
-
104
-
105
-
106
-
107
-
108
-
109
-
110
-
111
-
112
-
113
-
 114
114 -
 115
115 -
 116
116 -
 117
117 -
 118
118 -
 119
119 -
 120
120 -
 121
121 -
 122
122 -
 123
123 -
 124
124 -
 125
125 -
 126
126 -
 127
127 -
 128
128 -
 129
129 -
 130
130 -
 131
131 -
 132
132 -
 133
133 -
 134
134 -
135
-
136
-
137
-
138
-
139
-
140
-
141
-
142
-
143
-
144
-
145
-
146
-
147
-
148
-
149
-
150
-
151
-
152
-
153
-
154
-
155
-
156
-
157
-
158
-
159
-
160
-
161
-
162
-
163
 |
 |

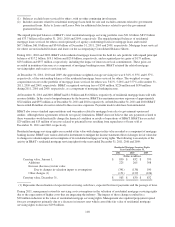
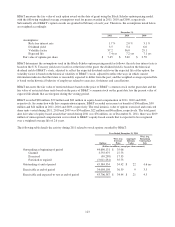
The following table details the activity during 2011 related to restricted shares and restricted share units awarded by BB&T:
Year Ended
December 31, 2011
Shares/Units
Wtd. Avg.
Grant Date
Fair Value
Nonvested at beginning of period 13,283,786 $ 20.06
Granted 2,582,028 24.10
Vested (1,913,659) 29.40
Forfeited (489,525) 21.00
Nonvested at end of period 13,462,630 $ 19.47
At December 31, 2011, BB&T’s restricted shares and restricted share units had a weighted-average life of 2.1 years. At
December 31, 2011, management estimates that 13.1 million restricted shares and restricted share units will vest over a
weighted-average life of 2.1 years.
Share Repurchase Activity
At December 31, 2011, BB&T was authorized to repurchase an additional 44 million shares under the June 27, 2006
Board of Directors’ authorization. No shares of common stock were repurchased under this plan during 2011, 2010 or
2009.
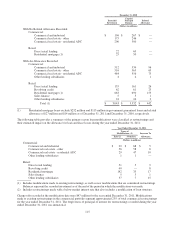
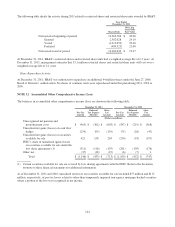
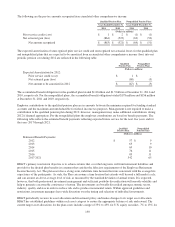
NOTE 12. Accumulated Other Comprehensive Income (Loss)
The balances in accumulated other comprehensive income (loss) are shown in the following table:
December 31, 2011 December 31, 2010
Pre-Tax
Amount
Deferred
Tax Expense
(Benefit)
After-
Tax
Amount
Pre-Tax
Amount
Deferred
Tax Expense
(Benefit)
After-
Tax
Amount
(Dollars in millions)
Unrecognized net pension and
postretirement costs $ (965) $ (362) $ (603) $ (587) $ (219) $ (368)
Unrealized net gains (losses) on cash flow
hedges (254) (95) (159) (75) (28) (47)
Unrealized net gains (losses) on securities
available for sale 421 158 263 (250) (93) (157)
FDIC’s share of unrealized (gains) losses
on securities available for sale under the
loss share agreements (1) (311) (116) (195) (281) (105) (176)
Other, net (37) (18) (19) (6) (7) 1
Total $ (1,146) $ (433) $ (713) $ (1,199) $ (452) $ (747)
(1) Certain securities available for sale are covered by loss sharing agreements with the FDIC. Refer to the Securities
footnote to these financial statements for additional information.
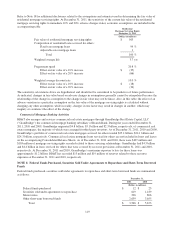
As of December 31, 2011 and 2010, unrealized net losses on securities available for sale included $57 million and $115
million, respectively, of pre-tax losses related to other-than-temporarily impaired non-agency mortgage-backed securities
where a portion of the loss was recognized in net income.
124