BB&T 2011 Annual Report Download - page 131
Download and view the complete annual report
Please find page 131 of the 2011 BB&T annual report below. You can navigate through the pages in the report by either clicking on the pages listed below, or by using the keyword search tool below to find specific information within the annual report.-
 1
1 -
2
-
3
-
4
-
5
-
6
-
7
-
8
-
9
-
10
-
11
-
12
-
13
-
14
-
15
-
16
-
17
-
18
-
19
-
20
-
21
-
22
-
23
-
24
-
25
-
26
-
27
-
28
-
29
-
30
-
31
-
32
-
33
-
34
-
35
-
36
-
37
-
38
-
39
-
40
-
41
-
42
-
43
-
44
-
45
-
46
-
47
-
48
-
49
-
50
-
51
-
52
-
53
-
54
-
55
-
56
-
57
-
58
-
59
-
60
-
61
-
62
-
63
-
64
-
65
-
66
-
67
-
68
-
69
-
70
-
71
-
72
-
73
-
74
-
75
-
76
-
77
-
78
-
79
-
80
-
81
-
82
-
83
-
84
-
85
-
86
-
87
-
88
-
89
-
90
-
91
-
92
-
93
-
94
-
95
-
96
-
97
-
98
-
99
-
100
-
101
-
102
-
103
-
104
-
105
-
106
-
107
-
108
-
109
-
110
-
111
-
112
-
113
-
114
-
115
-
116
-
117
-
118
-
119
-
120
-
 121
121 -
 122
122 -
 123
123 -
 124
124 -
 125
125 -
 126
126 -
 127
127 -
 128
128 -
 129
129 -
 130
130 -
 131
131 -
 132
132 -
 133
133 -
 134
134 -
 135
135 -
 136
136 -
 137
137 -
 138
138 -
 139
139 -
 140
140 -
 141
141 -
142
-
143
-
144
-
145
-
146
-
147
-
148
-
149
-
150
-
151
-
152
-
153
-
154
-
155
-
156
-
157
-
158
-
159
-
160
-
161
-
162
-
163
 |
 |

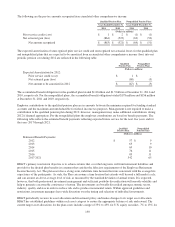
international equity securities, 20% to 30% for fixed income securities, and 3% to 30% for alternative investments, which
include real estate, hedge funds, private equities and commodities, with any remainder to be held in cash equivalents. In
June 2011, the Compensation Committee revised the asset allocation strategy for the Plan and the Trust to lower the
allocation of alternative investments. Currently, the asset allocations of certain plan asset classes may be outside of
established parameters while transition to the new asset allocation strategy.
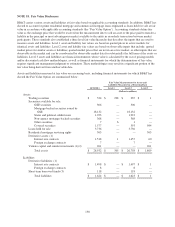
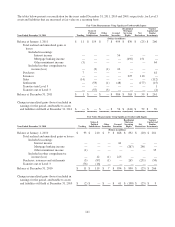
The fair value of BB&T’s pension plan assets at December 31, 2011 and 2010, by asset category are reflected in the
following tables. The three level fair value hierarchy that describes the inputs used to measure these plan assets is defined
in Note 18 “Fair Value Disclosures”.
Fair Value Measurements for Plan Assets
12/31/11 Level 1 Level 2 Level 3
(Dollars in millions)
Plan assets:
U.S. equity securities (1) $ 1,072 $ 1,072 $ - $ -
International equity securities (2) 439 336 103 -
Fixed income securities 852 130 722 -
Alternative investments 99 - - 99
Total plan assets (3) $ 2,462 $ 1,538 $ 825 $ 99
(1) Included in U.S. equity securities is 3.6 million shares of BB&T common stock valued at $92 million at
December 31, 2011.
(2) This category included a common/commingled fund that is comprised of assets from several accounts, pooled
together, to reduce management and administration costs.
(3) The total fair value of plan assets excludes $16 million of accrued income at December 31, 2011.
Fair Value Measurements for Plan Assets
12/31/10 Level 1 Level 2 Level 3
(Dollars in millions)
Plan assets:
U.S. equity securities (1) $ 1,098 $ 1,098 $ - $ -
International equity securities (2) 488 384 104 -
Fixed income securities 766 121 645 -
Alternative investments 124 - - 124
Total plan assets (3) $ 2,476 $ 1,603 $ 749 $ 124
(1) Included in U.S. equity securities is 3.6 million shares of BB&T common stock valued at $95 million at
December 31, 2010.
(2) This category included a common/commingled fund that is comprised of assets from several accounts, pooled
together, to reduce management and administration costs.
(3) The total fair value of plan assets excludes $8 million of accrued income at December 31, 2010.
131