BB&T 2011 Annual Report Download - page 67
Download and view the complete annual report
Please find page 67 of the 2011 BB&T annual report below. You can navigate through the pages in the report by either clicking on the pages listed below, or by using the keyword search tool below to find specific information within the annual report.-
 1
1 -
2
-
3
-
4
-
5
-
6
-
7
-
8
-
9
-
10
-
11
-
12
-
13
-
14
-
15
-
16
-
17
-
18
-
19
-
20
-
21
-
22
-
23
-
24
-
25
-
26
-
27
-
28
-
29
-
30
-
31
-
32
-
33
-
34
-
35
-
36
-
37
-
38
-
39
-
40
-
41
-
42
-
43
-
44
-
45
-
46
-
47
-
48
-
49
-
50
-
51
-
52
-
53
-
54
-
55
-
56
-
 57
57 -
 58
58 -
 59
59 -
 60
60 -
 61
61 -
 62
62 -
 63
63 -
 64
64 -
 65
65 -
 66
66 -
 67
67 -
 68
68 -
 69
69 -
 70
70 -
 71
71 -
 72
72 -
 73
73 -
 74
74 -
 75
75 -
 76
76 -
 77
77 -
78
-
79
-
80
-
81
-
82
-
83
-
84
-
85
-
86
-
87
-
88
-
89
-
90
-
91
-
92
-
93
-
94
-
95
-
96
-
97
-
98
-
99
-
100
-
101
-
102
-
103
-
104
-
105
-
106
-
107
-
108
-
109
-
110
-
111
-
112
-
113
-
114
-
115
-
116
-
117
-
118
-
119
-
120
-
121
-
122
-
123
-
124
-
125
-
126
-
127
-
128
-
129
-
130
-
131
-
132
-
133
-
134
-
135
-
136
-
137
-
138
-
139
-
140
-
141
-
142
-
143
-
144
-
145
-
146
-
147
-
148
-
149
-
150
-
151
-
152
-
153
-
154
-
155
-
156
-
157
-
158
-
159
-
160
-
161
-
162
-
163
 |
 |

Applicable ratios are annualized.
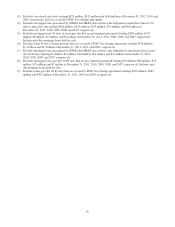
(1) Commercial real estate loans (CRE) are defined as loans to finance non-owner occupied real property where the
primary repayment source is the sale or rental/lease of the real property. Definition is based on internal classification.
Excludes covered loans and in process items.
(2) Includes net charge-offs and average balances related to loans transferred to held for sale while they were held for
investment. Loans transferred to held for sale are excluded from total loans outstanding. As of December 31, 2011,
there were no ADC loans or other CRE loans held for sale.
(3) C&I loans secured by real property are excluded.
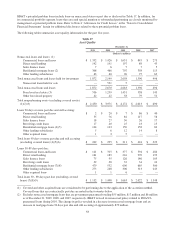
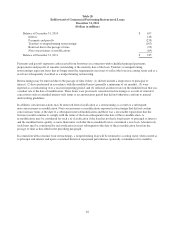
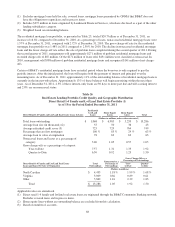
The commercial real estate-residential ADC loans held for investment portfolio totaled $2.1 billion at December 31, 2011,
a decrease of $1.3 billion from December 31, 2010. Nonaccrual ADC loans held for investment were $376 million at
December 31, 2011, a decrease of $137 million, compared to $513 million at December 31, 2010. As a percentage of
loans held for investment, ADC nonaccruals were 18.26% at December 31, 2011, compared to 15.09% at December 31,
2010. The allowance for loan and lease losses that is assigned to the ADC portfolio was 13.9% and 13.8% of the ADC
portfolio as of December 31, 2011 and year-end 2010, respectively. The gross charge-off rate for the ADC portfolio was
11.01% for 2011, compared to 13.86% for 2010. The other component of the commercial real estate portfolio, which is
largely office buildings, hotels, warehouses, apartments, rental houses and shopping centers, totaled $10.7 billion at
December 31, 2011. As a percentage of loans held for investment, other commercial real estate nonaccruals were 3.68% at
December 31, 2011, compared with 3.53% at December 31, 2010. The gross charge-off rate for the other commercial real
estate portfolio was 2.53% for 2011 compared to 3.83% for 2010. The improvement in the net charge-off rate in the
commercial real estate portfolios was largely due to the losses taken in 2010 related to loans transferred to the held for
sale portfolio.
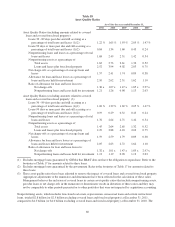
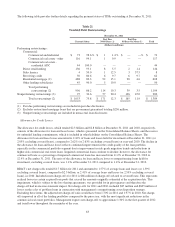
Table 25
Real Estate Lending Portfolio Credit Quality and Geographic Distribution
Residential Mortgage Portfolio (1)
As of / For the Period Ended December 31, 2011
Residential Mortgage Loans Prime ALT-A
Construction/
Permanent Subprime (2) Total
(Dollars in millions, unless noted otherwise)
Total loans outstanding $ 18,224 $ 1,696 $ 410 $ 413 $ 20,743
Average loan size (in thousands) 194 295 281 58 192
Average refreshed credit score (3) 731 696 729 577 725
Percentage that are first mortgages 100 % 100 % 100 % 82 % 100 %
Average loan to value at origination 73 68 73 74 73
Nonaccrual loans and leases as a
percentage of category 1.06 4.47 5.09 8.74 1.57
Gross charge-offs as a percentage of
category:
Year-to-Date 0.99 4.26 2.82 6.06 1.48
Quarter-to-Date 0.62 2.73 2.31 6.31 0.95
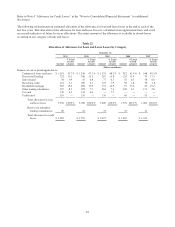
Total
Outstandings
Nonaccrual as a
Percentage of
Outstandings
Gross Charge-Offs as a
Percentage of Outstandings
Residential Mortgage Loans by State
Year-
to-Date
Quarter-
to-Date
(Dollars in millions)
North Carolina $ 4,960 1.30 % 0.97 % 0.66 %
Virginia 3,321 1.12 1.01 0.42
Florida 2,461 3.36 3.56 2.18
Other 10,001 1.42 1.37 0.97
Total $ 20,743 1.57 1.48 0.95
Applicable ratios are annualized.
67