BB&T 2011 Annual Report Download - page 78
Download and view the complete annual report
Please find page 78 of the 2011 BB&T annual report below. You can navigate through the pages in the report by either clicking on the pages listed below, or by using the keyword search tool below to find specific information within the annual report.-
 1
1 -
2
-
3
-
4
-
5
-
6
-
7
-
8
-
9
-
10
-
11
-
12
-
13
-
14
-
15
-
16
-
17
-
18
-
19
-
20
-
21
-
22
-
23
-
24
-
25
-
26
-
27
-
28
-
29
-
30
-
31
-
32
-
33
-
34
-
35
-
36
-
37
-
38
-
39
-
40
-
41
-
42
-
43
-
44
-
45
-
46
-
47
-
48
-
49
-
50
-
51
-
52
-
53
-
54
-
55
-
56
-
57
-
58
-
59
-
60
-
61
-
62
-
63
-
64
-
65
-
66
-
67
-
 68
68 -
 69
69 -
 70
70 -
 71
71 -
 72
72 -
 73
73 -
 74
74 -
 75
75 -
 76
76 -
 77
77 -
 78
78 -
 79
79 -
 80
80 -
 81
81 -
 82
82 -
 83
83 -
 84
84 -
 85
85 -
 86
86 -
 87
87 -
 88
88 -
89
-
90
-
91
-
92
-
93
-
94
-
95
-
96
-
97
-
98
-
99
-
100
-
101
-
102
-
103
-
104
-
105
-
106
-
107
-
108
-
109
-
110
-
111
-
112
-
113
-
114
-
115
-
116
-
117
-
118
-
119
-
120
-
121
-
122
-
123
-
124
-
125
-
126
-
127
-
128
-
129
-
130
-
131
-
132
-
133
-
134
-
135
-
136
-
137
-
138
-
139
-
140
-
141
-
142
-
143
-
144
-
145
-
146
-
147
-
148
-
149
-
150
-
151
-
152
-
153
-
154
-
155
-
156
-
157
-
158
-
159
-
160
-
161
-
162
-
163
 |
 |

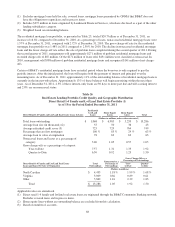
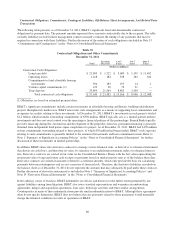
The following table shows the effect that the indicated changes in interest rates would have on EVE. Key assumptions in
the preparation of the table include prepayment speeds of mortgage-related assets, cash flows and maturities of derivative
financial instruments, loan volumes and pricing, and deposit sensitivity. The resulting change in the economic value of
equity reflects the level of sensitivity that EVE has in relation to changing interest rates.
Table 31
Economic Value of Equity (“EVE”) Simulation Analysis
Hypothetical Percentage
Change in EVE
Change in
Rates
EVE/Assets
December 31, December 31,
2011 2010 2011 2010
2.00 % 6.2 % 8.7 % 19.6 % 18.8 %
1.00 5.9 8.1 13.3 10.7
No Change 5.2 7.3 — —
(.25) 4.9 7.1 (4.9) (3.4)
Market Risk from Trading Activities
BB&T also manages market risk from trading activities which consists of acting as a financial intermediary to provide its
customers access to derivatives, foreign exchange and securities markets. Trading market risk is managed through the use
of statistical and non-statistical risk measures and limits, with overall established limits. BB&T utilizes a historical
value-at-risk (“VaR”) methodology to measure and aggregate risks across its covered trading lines of business. This
methodology uses one year of historical data to estimate economic outcomes for a one-day time horizon at a 99%
confidence level.
The average VaR for the year ended December 31, 2011 was approximately $1 million. The maximum daily VaR was
approximately $3 million, and the low daily VaR was less than $1 million during the same period.
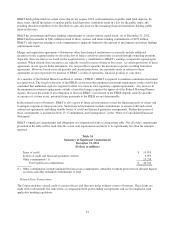
Liquidity
Liquidity represents BB&T’s continuing ability to meet funding needs, primarily deposit withdrawals, timely repayment
of borrowings and other liabilities, and funding of loan commitments. In addition to the level of liquid assets, such as
cash, cash equivalents and securities available for sale, many other factors affect the ability to meet liquidity needs,
including access to a variety of funding sources, maintaining borrowing capacity in national money markets, growing core
deposits, the repayment of loans and the capability to securitize or package loans for sale.
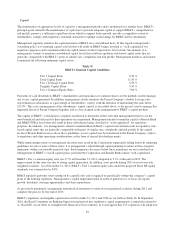
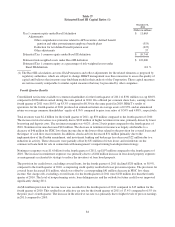
The purpose of the Parent Company is to serve as the capital financing vehicle for the operating subsidiaries. The assets of
the Parent Company consist primarily of cash on deposit with Branch Bank, equity investments in subsidiaries, advances
to subsidiaries, accounts receivable from subsidiaries, and other miscellaneous assets. The principal obligations of the
Parent Company are principal and interest on master notes, long-term debt, and redeemable capital securities. The main
sources of funds for the Parent Company are dividends and management fees from subsidiaries, repayments of advances
to subsidiaries, and proceeds from the issuance of long-term debt and master notes. The primary uses of funds by the
Parent Company are for investments in subsidiaries, advances to subsidiaries, dividend payments to shareholders,
retirement of common stock and interest and principal payments due on long-term debt and master notes.
The primary source of funds used for Parent Company cash requirements was dividends received from subsidiaries, which
totaled $903 million during 2011. In addition, the Parent Company issued $2.0 billion of senior notes during 2011 and
repaid $861 million of maturing long-term debt. Funds raised through master note agreements with commercial clients are
placed in a note receivable at Branch Bank primarily for its use in meeting short-term funding needs and, to a lesser
extent, to support the short-term temporary cash needs of the Parent Company. At December 31, 2011 and 2010, master
note balances totaled $296 million and $806 million, respectively.
The Parent Company had eight issues of senior notes outstanding totaling $5.0 billion and four issues of subordinated
notes outstanding totaling $2.4 billion at December 31, 2011. In addition, as of December 31, 2011, the Parent Company
had $3.3 billion of junior subordinated debentures outstanding to unconsolidated trusts. Management has announced
78