BB&T 2011 Annual Report Download - page 142
Download and view the complete annual report
Please find page 142 of the 2011 BB&T annual report below. You can navigate through the pages in the report by either clicking on the pages listed below, or by using the keyword search tool below to find specific information within the annual report.-
 1
1 -
2
-
3
-
4
-
5
-
6
-
7
-
8
-
9
-
10
-
11
-
12
-
13
-
14
-
15
-
16
-
17
-
18
-
19
-
20
-
21
-
22
-
23
-
24
-
25
-
26
-
27
-
28
-
29
-
30
-
31
-
32
-
33
-
34
-
35
-
36
-
37
-
38
-
39
-
40
-
41
-
42
-
43
-
44
-
45
-
46
-
47
-
48
-
49
-
50
-
51
-
52
-
53
-
54
-
55
-
56
-
57
-
58
-
59
-
60
-
61
-
62
-
63
-
64
-
65
-
66
-
67
-
68
-
69
-
70
-
71
-
72
-
73
-
74
-
75
-
76
-
77
-
78
-
79
-
80
-
81
-
82
-
83
-
84
-
85
-
86
-
87
-
88
-
89
-
90
-
91
-
92
-
93
-
94
-
95
-
96
-
97
-
98
-
99
-
100
-
101
-
102
-
103
-
104
-
105
-
106
-
107
-
108
-
109
-
110
-
111
-
112
-
113
-
114
-
115
-
116
-
117
-
118
-
119
-
120
-
121
-
122
-
123
-
124
-
125
-
126
-
127
-
128
-
129
-
130
-
131
-
 132
132 -
 133
133 -
 134
134 -
 135
135 -
 136
136 -
 137
137 -
 138
138 -
 139
139 -
 140
140 -
 141
141 -
 142
142 -
 143
143 -
 144
144 -
 145
145 -
 146
146 -
 147
147 -
 148
148 -
 149
149 -
 150
150 -
 151
151 -
 152
152 -
153
-
154
-
155
-
156
-
157
-
158
-
159
-
160
-
161
-
162
-
163
 |
 |

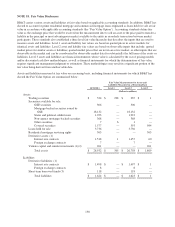
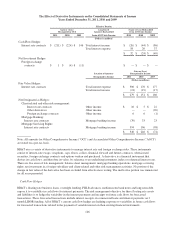
Fair Value Measurements Using Significant Unobservable Inputs
Year Ended December 31, 2009 Trading
States &
Political
Subdivisions
Non-agency
mortgage-
backed
securities
Other
Securities
Covered
Securities
Residential
Mortgage
Servicing
Rights
Net
Derivatives
Venture
Capital and
Similar
Investments
(Dollars in millions)
Balance at January 1, 2009 $ 4 $ — $ 1,098 $ 1 $ — $ 370 $ 37 $ 182
Total realized and unrealized gains or
losses:
Included in earnings:
Interest income — — — — 20 — — —
Mortgage banking income — — — — — 64 222 —
Other noninterest income (2) — — — — — — 6
Included in other comprehensive
income (loss) — (12) 142 — 19 — — —
Purchases, issuances and settlements 91 (6) (179) (1) (3) 398 (259) 93
Transfers into Level 3 from Colonial
acquisition — — — — 632 — (20) —
Transfers in and/or out of Level 3 — 228 (1,061) 9 — — — —
Balance at December 31, 2009 $ 93 $ 210 $ — $ 9 $ 668 $ 832 $ (20) $ 281
Change in unrealized gains (losses)
included in earnings for the period,
attributable to assets and liabilities
still held at December 31, 2009 $ (3) $ — $ — $ — $ 20 $ 190 $ (20) $ (2)
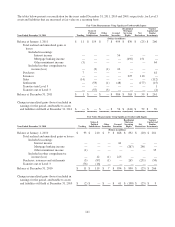
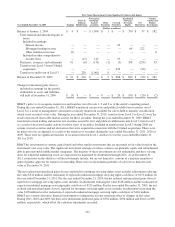
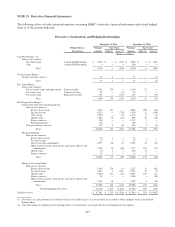
BB&T’s policy is to recognize transfers in and transfers out of Levels 1, 2 and 3 as of the end of a reporting period.
During the year ended December 31, 2011, BB&T transferred certain state and political subdivision securities out of
Level 3 as a result of management’s decision to reclassify them from available for sale to held to maturity classification,
which is not recorded at fair value. During the year ended December 31, 2010, transfers from Level 3 to Level 2 were the
result of increased observable market activity for these securities. During the year ended December 31, 2009, BB&T
transferred certain trading and auction rate securities issued by state and political subdivisions into Level 3 from Level 2
as a result of decreased market activity for these types of securities. Included in transfers into Level 3 during 2009 are
certain covered securities and net derivatives that were acquired in connection with the Colonial acquisition. There were
no gains or losses recognized as a result of the transfers of securities during the years ended December 31, 2011, 2010 or
2009. There were no significant transfers of securities between Level 1 and Level 2 for the years ended December 31,
2011 or 2010.
BB&T has investments in venture capital funds and other similar investments that are measured at fair value based on the
investment’s net asset value. The significant investment strategies for these ventures are primarily equity and subordinated
debt in privately-held middle market companies. The majority of these investments are not redeemable and have varying
dates for which the underlying assets are expected to be liquidated by distribution through 2021. As of December 31,
2011, restrictions on the ability to sell the investments include, but are not limited to, consent of a majority member or
general partner approval for transfer of ownership. There were no investments probable of sale for less than net asset
value at December 31, 2011.
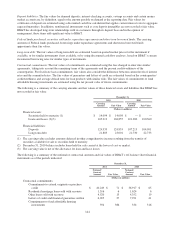
The net realized and unrealized gains (losses) reported for mortgage servicing rights assets includes adjustments reducing
the value $341 million and the realization of expected residential mortgage servicing rights cash flows of $151 million for
the year ended December 31, 2011. For the year ended December 31, 2010, the net realized and unrealized gains (losses)
reported for mortgage servicing rights assets includes an adjustment reducing the value $138 million and the realization of
expected residential mortgage servicing rights cash flows of $129 million. For the year ended December 31, 2009, the net
realized and unrealized gains (losses) reported for mortgage servicing rights assets includes an adjustment increasing the
value $190 million less the realization of expected residential mortgage servicing rights cash flows of $126 million.
BB&T uses various derivative financial instruments to mitigate the income statement effect of changes in fair value.
During 2011, 2010 and 2009, the derivative instruments produced gains of $394 million, $196 million and losses of $98
million, respectively, which offset the valuation adjustments recorded.
142