BB&T 2011 Annual Report Download - page 38
Download and view the complete annual report
Please find page 38 of the 2011 BB&T annual report below. You can navigate through the pages in the report by either clicking on the pages listed below, or by using the keyword search tool below to find specific information within the annual report.-
 1
1 -
2
-
3
-
4
-
5
-
6
-
7
-
8
-
9
-
10
-
11
-
12
-
13
-
14
-
15
-
16
-
17
-
18
-
19
-
20
-
21
-
22
-
23
-
24
-
25
-
26
-
27
-
 28
28 -
 29
29 -
 30
30 -
 31
31 -
 32
32 -
 33
33 -
 34
34 -
 35
35 -
 36
36 -
 37
37 -
 38
38 -
 39
39 -
 40
40 -
 41
41 -
 42
42 -
 43
43 -
 44
44 -
 45
45 -
 46
46 -
 47
47 -
 48
48 -
49
-
50
-
51
-
52
-
53
-
54
-
55
-
56
-
57
-
58
-
59
-
60
-
61
-
62
-
63
-
64
-
65
-
66
-
67
-
68
-
69
-
70
-
71
-
72
-
73
-
74
-
75
-
76
-
77
-
78
-
79
-
80
-
81
-
82
-
83
-
84
-
85
-
86
-
87
-
88
-
89
-
90
-
91
-
92
-
93
-
94
-
95
-
96
-
97
-
98
-
99
-
100
-
101
-
102
-
103
-
104
-
105
-
106
-
107
-
108
-
109
-
110
-
111
-
112
-
113
-
114
-
115
-
116
-
117
-
118
-
119
-
120
-
121
-
122
-
123
-
124
-
125
-
126
-
127
-
128
-
129
-
130
-
131
-
132
-
133
-
134
-
135
-
136
-
137
-
138
-
139
-
140
-
141
-
142
-
143
-
144
-
145
-
146
-
147
-
148
-
149
-
150
-
151
-
152
-
153
-
154
-
155
-
156
-
157
-
158
-
159
-
160
-
161
-
162
-
163
 |
 |
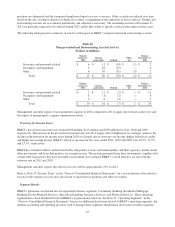
primarily the result of increased cash flow estimates resulting from improved loss expectations. These amounts are recognized
as prospective yield adjustments and result in increased interest income over the remaining lives of the loan pools.
The provision for covered loans was $71 million in 2011, a decrease of $73 million compared to the 2010. The provision
expenses recorded during 2011 and 2010 resulted from the reassessment process, which showed decreases in expected
cash flows in certain loan pools that were partially offset by recoveries in other previously impaired loan pools.
FDIC loss share income, net decreased $173 million compared to 2010 primarily due to the impact of cash flow
reassessments that generated additional interest income and a reduction of amounts due from the FDIC as a result of
decreased loss projections on covered loans.
The following table sets forth the major components of net interest income and the related annualized yields and rates for
2011, 2010 and 2009, as well as the variances between the periods caused by changes in interest rates versus changes in
volumes. Changes attributable to the mix of assets and liabilities have been allocated proportionally between the changes
due to rate and the changes due to volume.
38