BB&T 2011 Annual Report Download - page 130
Download and view the complete annual report
Please find page 130 of the 2011 BB&T annual report below. You can navigate through the pages in the report by either clicking on the pages listed below, or by using the keyword search tool below to find specific information within the annual report.-
 1
1 -
2
-
3
-
4
-
5
-
6
-
7
-
8
-
9
-
10
-
11
-
12
-
13
-
14
-
15
-
16
-
17
-
18
-
19
-
20
-
21
-
22
-
23
-
24
-
25
-
26
-
27
-
28
-
29
-
30
-
31
-
32
-
33
-
34
-
35
-
36
-
37
-
38
-
39
-
40
-
41
-
42
-
43
-
44
-
45
-
46
-
47
-
48
-
49
-
50
-
51
-
52
-
53
-
54
-
55
-
56
-
57
-
58
-
59
-
60
-
61
-
62
-
63
-
64
-
65
-
66
-
67
-
68
-
69
-
70
-
71
-
72
-
73
-
74
-
75
-
76
-
77
-
78
-
79
-
80
-
81
-
82
-
83
-
84
-
85
-
86
-
87
-
88
-
89
-
90
-
91
-
92
-
93
-
94
-
95
-
96
-
97
-
98
-
99
-
100
-
101
-
102
-
103
-
104
-
105
-
106
-
107
-
108
-
109
-
110
-
111
-
112
-
113
-
114
-
115
-
116
-
117
-
118
-
119
-
 120
120 -
 121
121 -
 122
122 -
 123
123 -
 124
124 -
 125
125 -
 126
126 -
 127
127 -
 128
128 -
 129
129 -
 130
130 -
 131
131 -
 132
132 -
 133
133 -
 134
134 -
 135
135 -
 136
136 -
 137
137 -
 138
138 -
 139
139 -
 140
140 -
141
-
142
-
143
-
144
-
145
-
146
-
147
-
148
-
149
-
150
-
151
-
152
-
153
-
154
-
155
-
156
-
157
-
158
-
159
-
160
-
161
-
162
-
163
 |
 |

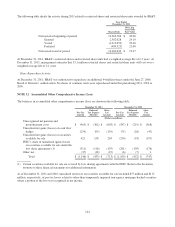
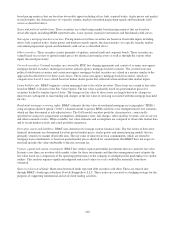
The following are the pre-tax amounts recognized in accumulated other comprehensive income:
Qualified Pension Plan Nonqualified Pension Plans
Years Ended December 31, Years Ended December 31,
2011 2010 2011 2010
(Dollars in millions)
Prior service credit (cost) $ 1 $ 2 $ (1) $ (1)
Net actuarial gain (loss) (864) (523) (63) (50)
Net amount recognized $ (863) $ (521) $ (64) $ (51)
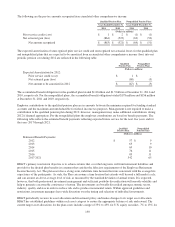
The expected amortization of unrecognized prior service credit and unrecognized net actuarial losses for the qualified plan
and nonqualified plans that are expected to be amortized from accumulated other comprehensive income (loss) into net
periodic pension cost during 2012 are reflected in the following table:
Qualified
Pension Plan
Nonqualified
Pension Plans
(Dollars in millions)
Expected Amortization for 2012:
Prior service credit (cost) $ 1 $ -
Net actuarial gain (loss) (68) (5)
Net amount to be amortized in 2012 $ (67) $ (5)
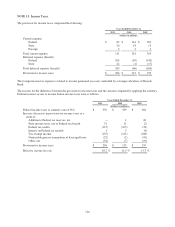
The accumulated benefit obligation for the qualified plan totaled $1.8 billion and $1.5 billion at December 31, 2011 and
2010, respectively. For the nonqualified plans, the accumulated benefit obligation totaled $178 million and $156 million
at December 31, 2011 and 2010, respectively.
Employer contributions to the qualified pension plan are in amounts between the minimum required for funding standard
accounts and the maximum amount deductible for federal income tax purposes. Management is not required to make a
contribution to the qualified pension plan during 2012; however, management may make additional contributions during
2012 if deemed appropriate. For the nonqualified plans the employer contributions are based on benefit payments. The
following table reflects the estimated benefit payments reflecting expected future service for the next five years and for
the years 2017 through 2021.
Qualified
Pension Plan
Nonqualified
Pension Plans
(Dollars in millions)
Estimated Benefit Payments:
2012 $ 57 $ 9
2013 63 9
2014 69 10
2015 76 11
2016 83 11
2017-2021 542 65
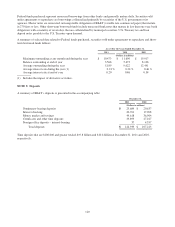
BB&T’s primary total return objective is to achieve returns that, over the long term, will fund retirement liabilities and
provide for the desired plan benefits in a manner that satisfies the fiduciary requirements of the Employee Retirement
Income Security Act. The plan assets have a long-term, indefinite time horizon that runs concurrent with the average life
expectancy of the participants. As such, the Plan can assume a time horizon that extends well beyond a full market cycle,
and can assume an above-average level of risk, as measured by the standard deviation of annual return. It is expected,
however, that both professional investment management and sufficient portfolio diversification will smooth volatility and
help to generate a reasonable consistency of return. The investments are broadly diversified among economic sector,
industry, quality and size in order to reduce risk and to produce incremental return. Within approved guidelines and
restrictions, investment managers have wide discretion over the timing and selection of individual investments.
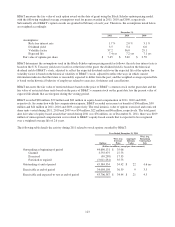
BB&T periodically reviews its asset allocation and investment policy and makes changes to its target asset allocation.
BB&T has established guidelines within each asset category to ensure the appropriate balance of risk and reward. The
current target asset allocations for the plan assets include a range of 35% to 45% for U.S. equity securities, 7% to 13% for
130