BB&T 2011 Annual Report Download - page 41
Download and view the complete annual report
Please find page 41 of the 2011 BB&T annual report below. You can navigate through the pages in the report by either clicking on the pages listed below, or by using the keyword search tool below to find specific information within the annual report.-
 1
1 -
2
-
3
-
4
-
5
-
6
-
7
-
8
-
9
-
10
-
11
-
12
-
13
-
14
-
15
-
16
-
17
-
18
-
19
-
20
-
21
-
22
-
23
-
24
-
25
-
26
-
27
-
28
-
29
-
30
-
 31
31 -
 32
32 -
 33
33 -
 34
34 -
 35
35 -
 36
36 -
 37
37 -
 38
38 -
 39
39 -
 40
40 -
 41
41 -
 42
42 -
 43
43 -
 44
44 -
 45
45 -
 46
46 -
 47
47 -
 48
48 -
 49
49 -
 50
50 -
 51
51 -
52
-
53
-
54
-
55
-
56
-
57
-
58
-
59
-
60
-
61
-
62
-
63
-
64
-
65
-
66
-
67
-
68
-
69
-
70
-
71
-
72
-
73
-
74
-
75
-
76
-
77
-
78
-
79
-
80
-
81
-
82
-
83
-
84
-
85
-
86
-
87
-
88
-
89
-
90
-
91
-
92
-
93
-
94
-
95
-
96
-
97
-
98
-
99
-
100
-
101
-
102
-
103
-
104
-
105
-
106
-
107
-
108
-
109
-
110
-
111
-
112
-
113
-
114
-
115
-
116
-
117
-
118
-
119
-
120
-
121
-
122
-
123
-
124
-
125
-
126
-
127
-
128
-
129
-
130
-
131
-
132
-
133
-
134
-
135
-
136
-
137
-
138
-
139
-
140
-
141
-
142
-
143
-
144
-
145
-
146
-
147
-
148
-
149
-
150
-
151
-
152
-
153
-
154
-
155
-
156
-
157
-
158
-
159
-
160
-
161
-
162
-
163
 |
 |
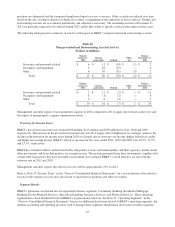
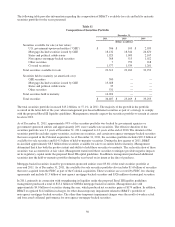
Noninterest income was $3.1 billion for 2011, down 21.3% compared to 2010. The decline in noninterest revenue was due
to fewer securities gains, lower income related to the FDIC loss share receivable, lower service charges on deposit
accounts and lower mortgage banking revenues, while bankcard fees and merchant discounts and trust and investment
advisory revenues grew compared to the prior year. Noninterest income was up slightly in 2010 compared to 2009. The
growth in 2010 primarily was a result of an increase in securities gains and higher revenues from checkcard fees, bankcard
fees and merchant discounts, and trust and investment advisory revenues, offset by lower revenues from BB&T’s
mortgage banking operations, lower noninterest income from the FDIC loss share receivable, reduced service charges on
deposit accounts and lower revenues from other noninterest income sources. The major categories of noninterest income
and fluctuations in these amounts are discussed in the following paragraphs. These fluctuations include the impact of
acquisitions.
Income from BB&T’s insurance agency/brokerage operations was the largest source of noninterest income. Insurance
income was up slightly in 2011, as pricing for premiums remained soft throughout the year. Insurance income was down
slightly in 2010. Insurance commissions declined $29 million during 2010 reflecting continued softness in the industry’s
pricing for premiums, which was partially offset by an increase of $23 million in insurance income from underwriting
activities. The decline in insurance commissions was primarily related to property and casualty insurance.
Service charges on deposit accounts represent BB&T’s second largest category of noninterest revenue. Service charges
declined $55 million, or 8.9%, in 2011. Service charge revenue declined $72 million, or 10.4%, during 2010. The
decreases in 2011 and 2010 were largely a result of a decline in overdraft fees as a result of mid-2010 changes to BB&T’s
overdraft policies that were partially in response to new regulation. In 2011, management implemented various changes to
deposit related products, which generated additional revenue and partially offset the reduction in overdraft fees.
Income from mortgage banking activities includes gains and losses from the sale of mortgage loans, revenue from
servicing mortgage loans, valuation adjustments for mortgage servicing rights, mortgage servicing rights-related
derivative gains/losses and the amortization or realization of expected mortgage servicing rights cash flows. Mortgage
banking income totaled $436 million, $521 million and $658 million during 2011, 2010 and 2009, respectively. The
decrease of $85 million in 2011 was primarily due to a decline of $97 million in residential mortgage production revenues
due to lower volumes and pricing in 2011 and the decision in the third quarter of 2010 to retain a portion of 10 to 15 year
mortgage production. This decline was partially offset by higher servicing revenues as a result of growth in the servicing
portfolio and higher revenues from commercial mortgage banking revenues. Included in mortgage banking income for
2011 is a negative valuation adjustment of $341 million related to changes in assumptions for residential mortgage
servicing rights that are carried at fair value. This was more than offset by gains of $394 million from derivative financial
instruments used to manage the economic risk. Approximately $293 million of the decline in the valuation of the
residential mortgage servicing rights was due to increases in the prepayment speed assumption as a result of a decrease in
interest rates. During 2011, management also revised its servicing cost assumption based on changes to regulations and
industry standards that impact the mortgage servicing industry. The change in the servicing cost assumption resulted in a
decline of approximately $30 million in the valuation of the mortgage servicing asset. BB&T was not a party to the
consent orders issued to various mortgage servicers in the second quarter of 2011, however certain changes will impact
the entire industry and are considered in the Company’s quarterly valuation. Mortgage banking income decreased $137
million, or 20.8%, during 2010, following a record year in 2009. Residential mortgage production income declined $156
million compared with 2009 due to lower gains on sales in the current year, as originations declined and the proportion of
loans sold decreased due to a decision in the third quarter of 2010 to retain a portion of 10 to 15 year mortgage production.
Residential mortgage servicing income was relatively flat in 2010 compared to 2009, as growth in servicing fees of $36
million from an increase in the size of the loan servicing portfolio was offset by a $35 million unfavorable net change in
the valuation for mortgage servicing rights and related economic hedging activities. Commercial mortgage banking
income was up $21 million, or 46.7%, in 2010 due to improved market conditions.
Investment banking and brokerage fees and commissions decreased $19 million, or 5.4%, compared to 2010, which
increased $6 million, or 1.7%, compared to 2009. The decrease in 2011 was largely driven by lower revenues at BB&T
Capital Markets, a division of Scott & Stringfellow, due to weaker market conditions during the year and a record fourth
quarter in 2010. The increase in 2010 was largely driven by record fourth quarter performance as market conditions
temporarily improved and more equity and fixed income deals were brought to market.
41