BB&T 2011 Annual Report Download - page 68
Download and view the complete annual report
Please find page 68 of the 2011 BB&T annual report below. You can navigate through the pages in the report by either clicking on the pages listed below, or by using the keyword search tool below to find specific information within the annual report.-
 1
1 -
2
-
3
-
4
-
5
-
6
-
7
-
8
-
9
-
10
-
11
-
12
-
13
-
14
-
15
-
16
-
17
-
18
-
19
-
20
-
21
-
22
-
23
-
24
-
25
-
26
-
27
-
28
-
29
-
30
-
31
-
32
-
33
-
34
-
35
-
36
-
37
-
38
-
39
-
40
-
41
-
42
-
43
-
44
-
45
-
46
-
47
-
48
-
49
-
50
-
51
-
52
-
53
-
54
-
55
-
56
-
57
-
 58
58 -
 59
59 -
 60
60 -
 61
61 -
 62
62 -
 63
63 -
 64
64 -
 65
65 -
 66
66 -
 67
67 -
 68
68 -
 69
69 -
 70
70 -
 71
71 -
 72
72 -
 73
73 -
 74
74 -
 75
75 -
 76
76 -
 77
77 -
 78
78 -
79
-
80
-
81
-
82
-
83
-
84
-
85
-
86
-
87
-
88
-
89
-
90
-
91
-
92
-
93
-
94
-
95
-
96
-
97
-
98
-
99
-
100
-
101
-
102
-
103
-
104
-
105
-
106
-
107
-
108
-
109
-
110
-
111
-
112
-
113
-
114
-
115
-
116
-
117
-
118
-
119
-
120
-
121
-
122
-
123
-
124
-
125
-
126
-
127
-
128
-
129
-
130
-
131
-
132
-
133
-
134
-
135
-
136
-
137
-
138
-
139
-
140
-
141
-
142
-
143
-
144
-
145
-
146
-
147
-
148
-
149
-
150
-
151
-
152
-
153
-
154
-
155
-
156
-
157
-
158
-
159
-
160
-
161
-
162
-
163
 |
 |

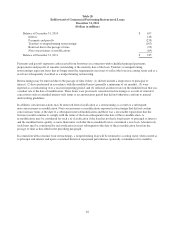
(1) Excludes mortgage loans held for sale, covered loans, mortgage loans guaranteed by GNMA that BB&T does not
have the obligation to repurchase and in process items.
(2) Includes $297 million in loans originated by Lendmark Financial Services, which are disclosed as a part of the other
lending subsidiaries category.
(3) Weighted based on outstanding balance.
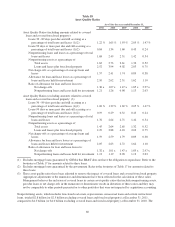
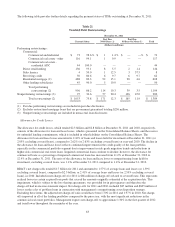
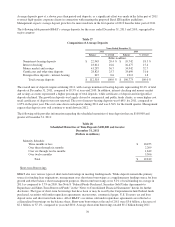
The residential mortgage loan portfolio, as presented in Table 25, totaled $20.7 billion as of December 31, 2011, an
increase of 16.6% compared to December 31, 2010. As a percentage of loans, nonaccrual residential mortgage loans were
1.57% at December 31, 2011, compared with 2.72% at December 31, 2010. The gross charge-off rate for the residential
mortgage loan portfolio was 1.48% in 2011 compared to 2.50% for 2010. The decline in nonaccrual residential mortgage
loans and the lower charge-off rate reflect the sale of problem loans completed during the second quarter of 2011. During
the second quarter of 2011, management sold approximately $271 million of problem residential mortgage loans and
recorded charge-offs of $87 million. Of the $271 million of loans sold, $231 million were classified as nonaccrual. In
2010, management sold $388 million of problem residential mortgage loans and recognized $141 million of net charge-
offs.
Certain of BB&T’s residential mortgage loans have an initial period where the borrower is only required to pay the
periodic interest. After the initial period, the loan will require both the payment of interest and principal over the
remaining term. As of December 31, 2011, approximately 11% of the outstanding balance of residential mortgage loans is
currently in the interest-only phase. Approximately 13% of these balances will begin amortizing within the next three
years. As of December 31, 2011, 4.3% of these interest-only loans are 30 days or more past due and still accruing interest
and 2.8% are on nonaccrual status.
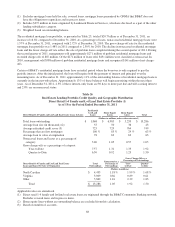
Table 26
Real Estate Lending Portfolio Credit Quality and Geographic Distribution
Direct Retail 1-4 Family and Lot/Land Real Estate Portfolio (1)
As of / For the Period Ended December 31, 2011
Direct Retail 1-4 Family and Lot/Land Real Estate Loans & Lines
Residential
Lot/Land
Loans
Home Equity
Loans
Home Equity
Lines Total
(Dollars in millions, unless otherwise noted)
Total loans outstanding $ 1,068 $ 6,985 $ 5,233 $ 13,286
Average loan size (in thousands) (2) 55 50 36 43
Average refreshed credit score (3) 725 729 764 749
Percentage that are first mortgages 100 % 83 % 29 % 63 %
Average loan to value at origination 78 62 63 63
Nonaccrual loans and leases as a percentage of
category 3.40 1.05 0.57 1.05
Gross charge-offs as a percentage of category:
Year-to-Date 7.57 1.31 1.33 1.92
Quarter-to-Date 6.30 0.92 1.23 1.50
Nonaccrual as a
Percentage of
Outstandings
Gross Charge-Offs as a
Percentage of Outstandings
Direct Retail 1-4 Family and Lot/Land Real Estate
Loans and Lines By State of Origination
Total
Outstandings
Year-
to-Date
Quarter-
to-Date
(Dollars in millions)
North Carolina $ 4,435 1.18 % 1.99 % 1.68 %
Virginia 3,009 0.66 0.89 0.61
Other 5,842 1.16 2.39 1.83
Total $ 13,286 1.05 1.92 1.50
Applicable ratios are annualized.
(1) Direct retail 1-4 family and lot/land real estate loans are originated through the BB&T Community Banking network.
Excludes covered loans and in process items.
(2) Home equity lines without an outstanding balance are excluded from this calculation.
(3) Based on number of accounts.
68