BB&T 2011 Annual Report Download - page 123
Download and view the complete annual report
Please find page 123 of the 2011 BB&T annual report below. You can navigate through the pages in the report by either clicking on the pages listed below, or by using the keyword search tool below to find specific information within the annual report.-
 1
1 -
2
-
3
-
4
-
5
-
6
-
7
-
8
-
9
-
10
-
11
-
12
-
13
-
14
-
15
-
16
-
17
-
18
-
19
-
20
-
21
-
22
-
23
-
24
-
25
-
26
-
27
-
28
-
29
-
30
-
31
-
32
-
33
-
34
-
35
-
36
-
37
-
38
-
39
-
40
-
41
-
42
-
43
-
44
-
45
-
46
-
47
-
48
-
49
-
50
-
51
-
52
-
53
-
54
-
55
-
56
-
57
-
58
-
59
-
60
-
61
-
62
-
63
-
64
-
65
-
66
-
67
-
68
-
69
-
70
-
71
-
72
-
73
-
74
-
75
-
76
-
77
-
78
-
79
-
80
-
81
-
82
-
83
-
84
-
85
-
86
-
87
-
88
-
89
-
90
-
91
-
92
-
93
-
94
-
95
-
96
-
97
-
98
-
99
-
100
-
101
-
102
-
103
-
104
-
105
-
106
-
107
-
108
-
109
-
110
-
111
-
112
-
 113
113 -
 114
114 -
 115
115 -
 116
116 -
 117
117 -
 118
118 -
 119
119 -
 120
120 -
 121
121 -
 122
122 -
 123
123 -
 124
124 -
 125
125 -
 126
126 -
 127
127 -
 128
128 -
 129
129 -
 130
130 -
 131
131 -
 132
132 -
 133
133 -
134
-
135
-
136
-
137
-
138
-
139
-
140
-
141
-
142
-
143
-
144
-
145
-
146
-
147
-
148
-
149
-
150
-
151
-
152
-
153
-
154
-
155
-
156
-
157
-
158
-
159
-
160
-
161
-
162
-
163
 |
 |

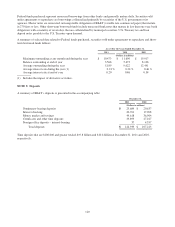
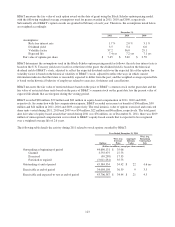
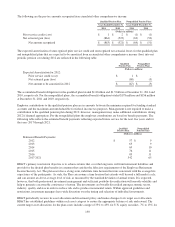
BB&T measures the fair value of each option award on the date of grant using the Black-Scholes option-pricing model
with the following weighted average assumptions used for grants awarded in 2011, 2010 and 2009, respectively.
Substantially all of BB&T’s option awards are granted in February of each year. Therefore, the assumptions noted below
are weighted accordingly:
December 31,
2011 2010 2009
Assumptions:
Risk-free interest rate 1.7 % 2.0 % 3.1 %
Dividend yield 3.5 5.4 6.0
Volatility factor 37.2 36.0 29.1
Expected life 7.4 yrs 7.2 yrs 7.1 yrs
Fair value of options per share $ 7.45 $ 5.60 $ 2.59
BB&T determines the assumptions used in the Black-Scholes option pricing model as follows: the risk-free interest rate is
based on the U.S. Treasury yield curve in effect at the time of the grant; the dividend yield is based on the historical
dividend yield of BB&T’s stock, adjusted to reflect the expected dividend yield over the expected life of the option; the
volatility factor is based on the historical volatility of BB&T’s stock, adjusted to reflect the ways in which current
information indicates that the future is reasonably expected to differ from the past; and the weighted-average expected life
is based on the historical behavior of employees related to exercises, forfeitures and cancellations.
BB&T measures the fair value of restricted shares based on the price of BB&T’s common stock on the grant date and the
fair value of restricted share units based on the price of BB&T’s common stock on the grant date less the present value of
expected dividends that are foregone during the vesting period.
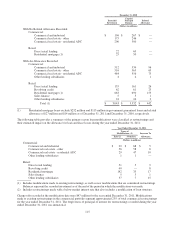
BB&T recorded $98 million, $79 million and $62 million in equity-based compensation in 2011, 2010 and 2009,
respectively. In connection with this compensation expense, BB&T recorded an income tax benefit of $36 million, $30
million and $24 million in 2011, 2010 and 2009, respectively. The total intrinsic value of options exercised and restricted
share units vested during 2011, 2010 and 2009 was $54 million, $22 million and $6 million, respectively. The total grant
date fair value of equity-based awards that vested during 2011 was $76 million. As of December 31, 2011, there was $109
million of unrecognized compensation costs related to BB&T’s equity-based awards that is expected to be recognized
over a weighted-average life of 2.6 years.
The following table details the activity during 2011 related to stock options awarded by BB&T:
Year Ended December 31, 2011
Wtd. Avg.
Wtd. Avg. Aggregate Remaining
Exercise Intrinsic Contractual
Options Price Value Life
(Dollars in millions, except per share amounts)
Outstanding at beginning of period 44,690,131 $ 35.06
Granted 3,755,975 27.73
Exercised (50,298) 17.33
Forfeited or expired (3,011,254) 35.73
Outstanding at end of period 45,384,554 34.42 $ 22 4.6 yrs
Exercisable at end of period 34,098,198 36.39 9 3.5
Exercisable and expected to vest at end of period 43,706,387 $ 34.44 $ 21 4.5
123