BB&T 2011 Annual Report Download - page 104
Download and view the complete annual report
Please find page 104 of the 2011 BB&T annual report below. You can navigate through the pages in the report by either clicking on the pages listed below, or by using the keyword search tool below to find specific information within the annual report.-
 1
1 -
2
-
3
-
4
-
5
-
6
-
7
-
8
-
9
-
10
-
11
-
12
-
13
-
14
-
15
-
16
-
17
-
18
-
19
-
20
-
21
-
22
-
23
-
24
-
25
-
26
-
27
-
28
-
29
-
30
-
31
-
32
-
33
-
34
-
35
-
36
-
37
-
38
-
39
-
40
-
41
-
42
-
43
-
44
-
45
-
46
-
47
-
48
-
49
-
50
-
51
-
52
-
53
-
54
-
55
-
56
-
57
-
58
-
59
-
60
-
61
-
62
-
63
-
64
-
65
-
66
-
67
-
68
-
69
-
70
-
71
-
72
-
73
-
74
-
75
-
76
-
77
-
78
-
79
-
80
-
81
-
82
-
83
-
84
-
85
-
86
-
87
-
88
-
89
-
90
-
91
-
92
-
93
-
 94
94 -
 95
95 -
 96
96 -
 97
97 -
 98
98 -
 99
99 -
 100
100 -
 101
101 -
 102
102 -
 103
103 -
 104
104 -
 105
105 -
 106
106 -
 107
107 -
 108
108 -
 109
109 -
 110
110 -
 111
111 -
 112
112 -
 113
113 -
 114
114 -
115
-
116
-
117
-
118
-
119
-
120
-
121
-
122
-
123
-
124
-
125
-
126
-
127
-
128
-
129
-
130
-
131
-
132
-
133
-
134
-
135
-
136
-
137
-
138
-
139
-
140
-
141
-
142
-
143
-
144
-
145
-
146
-
147
-
148
-
149
-
150
-
151
-
152
-
153
-
154
-
155
-
156
-
157
-
158
-
159
-
160
-
161
-
162
-
163
 |
 |

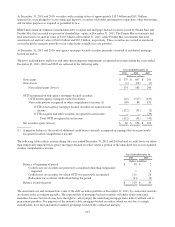
December 31, 2011
Available for Sale Held to Maturity
Amortized
Cost
Fair
Value
Amortized
Cost
Fair
Value
(Dollars in millions)
Due in one year or less $ 181 $ 181 $ — $ —
Due after one year through five years 150 152 — —
Due after five years through ten years 618 653 500 500
Due after ten years 20,937 21,321 13,594 13,598
Total debt securities 21,886 22,307 14,094 14,098
Total securities with no stated maturity 6 6 — —
Total securities $ 21,892 $ 22,313 $ 14,094 $ 14,098
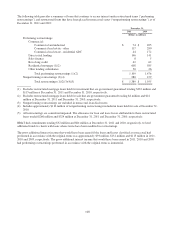
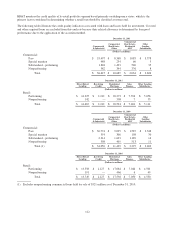
The following tables reflect the gross unrealized losses and fair values of BB&T’s investments, aggregated by investment
category and length of time that individual securities have been in a continuous unrealized loss position, at the dates presented:
December 31, 2011
Less than 12 months 12 months or more Total
Fair
Value
Unrealized
Losses
Fair
Value
Unrealized
Losses
Fair
Value
Unrealized
Losses
(Dollars in millions)
Securities available for sale:
GSE securities $ 24 $ — $ — $ — $ 24 $ —
Mortgage-backed securities issued by
GSE 3,098 7 — — 3,098 7
States and political subdivisions 453 68 265 77 718 145
Non-agency mortgage-backed
securities — — 368 55 368 55
Covered securities 29 6 — — 29 6
Total $ 3,604 $ 81 $ 633 $ 132 $ 4,237 $ 213
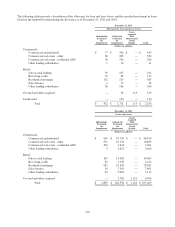
December 31, 2011
Less than 12 months 12 months or more Total
Fair
Value
Unrealized
Losses
Fair
Value
Unrealized
Losses
Fair
Value
Unrealized
Losses
(Dollars in millions)
Securities held to maturity:
GSE securities $ 250 $ — $ — $ — $ 250 $ —
Mortgage-backed securities issued by
GSE 7,770 23 — — 7,770 23
States and political subdivisions 33 2 — — 33 2
Other securities 207 4 — — 207 4
Total $ 8,260 $ 29 $ — $ — $ 8,260 $ 29
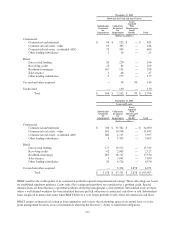
December 31, 2010
Less than 12 months 12 months or more Total
Fair
Value
Unrealized
Losses
Fair
Value
Unrealized
Losses
Fair
Value
Unrealized
Losses
(Dollars in millions)
Securities available for sale:
GSE securities $ 50 $ — $ — $ — $ 50 $ —
Mortgage-backed securities issued
by GSE 15,438 361 — — 15,438 361
States and political subdivisions 694 21 735 140 1,429 161
Non-agency mortgage-backed
securities — — 506 120 506 120
Other securities 535 2 2 — 537 2
Covered securities 79 2 — — 79 2
Total $ 16,796 $ 386 $ 1,243 $ 260 $ 18,039 $ 646
104