BB&T 2011 Annual Report Download - page 70
Download and view the complete annual report
Please find page 70 of the 2011 BB&T annual report below. You can navigate through the pages in the report by either clicking on the pages listed below, or by using the keyword search tool below to find specific information within the annual report.-
 1
1 -
2
-
3
-
4
-
5
-
6
-
7
-
8
-
9
-
10
-
11
-
12
-
13
-
14
-
15
-
16
-
17
-
18
-
19
-
20
-
21
-
22
-
23
-
24
-
25
-
26
-
27
-
28
-
29
-
30
-
31
-
32
-
33
-
34
-
35
-
36
-
37
-
38
-
39
-
40
-
41
-
42
-
43
-
44
-
45
-
46
-
47
-
48
-
49
-
50
-
51
-
52
-
53
-
54
-
55
-
56
-
57
-
58
-
59
-
 60
60 -
 61
61 -
 62
62 -
 63
63 -
 64
64 -
 65
65 -
 66
66 -
 67
67 -
 68
68 -
 69
69 -
 70
70 -
 71
71 -
 72
72 -
 73
73 -
 74
74 -
 75
75 -
 76
76 -
 77
77 -
 78
78 -
 79
79 -
 80
80 -
81
-
82
-
83
-
84
-
85
-
86
-
87
-
88
-
89
-
90
-
91
-
92
-
93
-
94
-
95
-
96
-
97
-
98
-
99
-
100
-
101
-
102
-
103
-
104
-
105
-
106
-
107
-
108
-
109
-
110
-
111
-
112
-
113
-
114
-
115
-
116
-
117
-
118
-
119
-
120
-
121
-
122
-
123
-
124
-
125
-
126
-
127
-
128
-
129
-
130
-
131
-
132
-
133
-
134
-
135
-
136
-
137
-
138
-
139
-
140
-
141
-
142
-
143
-
144
-
145
-
146
-
147
-
148
-
149
-
150
-
151
-
152
-
153
-
154
-
155
-
156
-
157
-
158
-
159
-
160
-
161
-
162
-
163
 |
 |

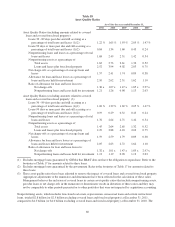
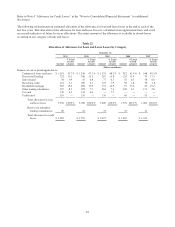
Average deposits grew at a slower pace than period-end deposits, as a significant effort was made in the latter part of 2011
to attract high-quality corporate clients in connection with meeting the proposed Basel III liquidity guidelines.
Management expects average deposit growth to be more moderate in the first quarter of 2012 than the latter part of 2011.
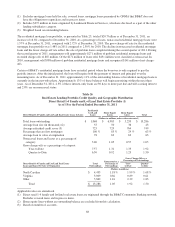
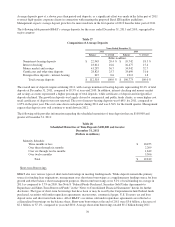
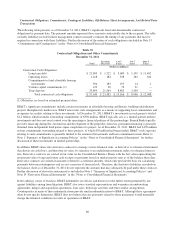
The following table presents BB&T’s average deposits for the years ended December 31, 2011 and 2010, segregated by
major category:
Table 27
Composition of Average Deposits
Years Ended December 31,
2011 2010
Balance % of total Balance % of total
(Dollars in millions)
Noninterest-bearing deposits $ 22,945 20.4 % $ 19,742 18.5 %
Interest checking 18,614 16.6 16,477 15.4
Money market and savings 41,287 36.7 34,942 32.7
Certificates and other time deposits 28,825 25.7 33,699 31.6
Foreign office deposits - interest-bearing 647 0.6 1,913 1.8
Total average deposits $ 112,318 100.0 % $ 106,773 100.0 %
The overall mix of deposits improved during 2011, with average noninterest-bearing deposits representing 20.4% of total
deposits at December 31, 2011, compared to 18.5% at year-end 2010. In addition, interest checking and money market
and savings accounts represented a higher percentage of total deposits, while certificates of deposit and foreign office
deposits declined. The growth in deposits was largely driven by commercial and public funds clients, as some higher cost
retail certificates of deposit were not renewed. The cost of interest-bearing deposits was 0.68% for 2011, compared to
1.05% in the prior year. The cost came down each quarter during 2011 and was 0.56% for the fourth quarter. Management
expects that deposit costs will continue to trend down in 2012.
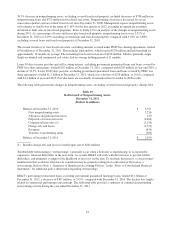
The following table provides information regarding the scheduled maturities of time deposits that are $100,000 and
greater at December 31, 2011:
Table 28
Scheduled Maturities of Time Deposits $100,000 and Greater
December 31, 2011
(Dollars in millions)
Maturity Schedule:
Three months or less $ 10,455
Over three through six months 2,209
Over six through twelve months 1,849
Over twelve months 5,306
Total $ 19,819
Short-term Borrowings
BB&T also uses various types of short-term borrowings in meeting funding needs. While deposits remain the primary
source for funding loan originations, management uses short-term borrowings as a supplementary funding source for loan
growth and other balance sheet management purposes. Short-term borrowings were 3.2% of total funding on average in
2011 as compared to 5.7% in 2010. See Note 8 “Federal Funds Purchased, Securities Sold Under Agreements to
Repurchase and Short-Term Borrowed Funds” in the “Notes to Consolidated Financial Statements” herein for further
disclosure. The types of short-term borrowings that have been or may be used by the Corporation include Federal funds
purchased, securities sold under repurchase agreements, master notes, commercial paper, U.S. Treasury tax and loan
deposit notes and short-term bank notes. All of BB&T’s securities sold under repurchase agreements are reflected as
collateralized borrowings on the balance sheet. Short-term borrowings at the end of 2011 were $3.6 billion, a decrease of
$2.1 billion, or 37.1%, compared to year-end 2010. Average short-term borrowings totaled $5.2 billion during 2011
70